
 Spend any time at all in the machine learning space, and pretty soon you will encounter the term “feature”. It’s a term that may seem self-evident at first, but it very quickly descends into a level of murkiness that can leave most laypeople (and even many programmers) confused, especially when you hear examples of machine learning systems that involve millions or even billions of features.
If you take a look at a spreadsheet, you can think of a feature as being roughly analogous to a column of data, along with the metadata that describes that column. This means that each cell in that column (which corresponds to a given “record”) becomes one item in an array, not including any header labels for that column. The feature could have potentially thousands of values, but they are all values of the same type and semantics.
However, there are two additional requirements that act on features. The first is that any two features should be independent – that is to say, the values of one feature should in general not be directly dependent upon the same indexed values of another feature. In practice, however, identifying truly unique features can often prove to be far more complex than may be obvious on the surface, and the best that can be hoped for is that there is, at worst, only minimal correlation between two features.
The second aspect of feature values is that they need to be normalized – that is to say, they have to be converted into a value between zero and one inclusive. The reason for this is that such normalized values can be plugged into matrix calculations in a way that other forms of data can’t. For straight numeric data, this is usually is sample as finding the minimum and maximum values of a feature, then interpolating to find where a specific value is within that set. For ordered ranges (such as the degree to which you liked or disliked a movie, on a scale of 1 to 5), the same kind of interpolation can be done. As an example, if you liked the movie but didn’t love it (4 out of 5), this would be interpolated as (5-4)/(5-1) = 3/4 = 0.75, and the feature for (Loved the Movie) when asked of 10 people might then look like:
Other types of data present more problematic conversions. For instance, enumerated sets can be converted in a similar fashion, but if there’s no intrinsic ordering, assigning a numeric value doesn’t make as much sense. This is why enumerated features are often decomposed into multiple like/dislike type questions. For instance, rather than trying to describe the genre of a movie, a feature-set might be modeled as multiple range questions:
- On a scale of 1 to 5, was the movie more serious or funny?
- On a scale of 1 to 5, was the movie more realistic or more fantastic?
- On a scale of 1 to 5, was the movie more romantic or more action oriented?
A feature set then is able to describe a genre by taking each score (normalized) and using it to identify a point in an n-dimensional space. This might sound a bit intimidating, but another way of thinking about it is that you have three (or n) dials (as in a sound mixer board) that can go from 0 to 10. Certain combinations of these dial settings can get you closer to or farther from a given effect (Princess Bride might have a “funny” of 8, a “fantasy” of 8 and an “action oriented” of 4). Shrek might have something around these same scores, meaning if they were described as comedic fantasy romance and you liked Princess Bride, you stand a good chance of liking Shrek.
Collectively, if you have several such features with the same row identifiers (a table, in essence), this is known as a feature vector. The more rows (items) that a given feature has, the more that you’ll see statistical patterns such as clustering, where several points are close to one another in at least some subset of the possible features. This can be an indication of similarity, which is how classifiers can work to say that two objects fall into the same category.
However, there’s also a caveat involved here. Not all features have equal impact. For instance, it’s perfectly possible to have a feature be the cost of popcorn. Now, it’s unlikely that the cost of popcorn has any impact whatsoever on the genre of a movie. Put another way, the weight, or significance, of that particular feature is very low. When building a model, then, one of the things that needs to be determined is, given a set of features, what weights associated with those features should be applied to get the most accurate model.
This is basically how (many) machine learning algorithms work. The feature values are known ahead of time for a training set. A machine-learning algorithm uses a set of neurons (common connections) between a starting set of weights, testing the weights against the expected values in order to identify a gradient (slope) and from that recalibrate the weights to find where to move next. Once this new vector is determined, the process is repeated until a local minimum value or stable orbit is found. These points of stability represent clusters of information, or classifications, based upon the incoming labels
Assuming that new data has the same statistical characteristics as the test data, the weighted values determine a computational model. Multiply the new feature values by the corresponding weights (using matrix multiplication here) and you can then backtrack to find the most appropriate labels. In other words, the learning data identifies the model (the set of features and their weights) for a given classification, while the test data uses that model to classify or predict new content.
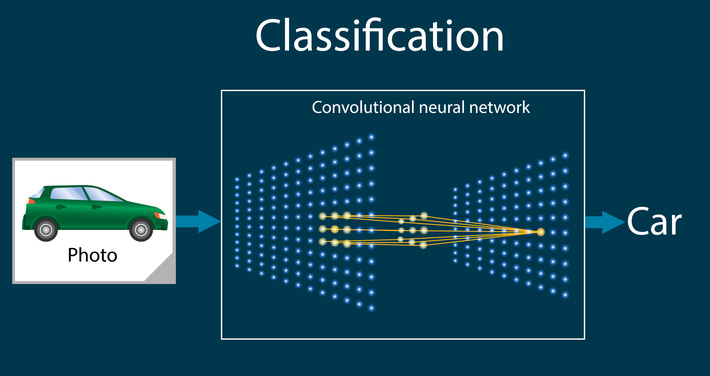
There are variations on a theme. With supervised learning, the classifications are provided a priori, and the algorithm essentially acts as an index into the features that make up a given classification. With unsupervised learning, on the other hand, the clustering comes before the labeling of the categories, so that a human being at some point would have to associate a previously unknown cluster to a category. As to what those categories (or labels) are, they could be anything – lines or shapes in a visual grid that render to a car or a truck, genre preferences, words likely to follow after other words, even (with a large enough dataset such as is used by Google’s GPT-3, whole passages or descriptions constructed from a skeletal structures of features and (most importantly) patterns.
Indeed, machine learning is actually a misnomer (most of the time). These are pattern recognition algorithms. They become learning algorithms when they become re-entrant – when at least some of the data that is produced (inferred) by the model gets reincorporated into the model even as new information is fed into it. This is essentially how reinforcement learning takes place, in which new data (stimuli) causes the model to dynamically change, retaining and refining new inferences while “forgetting” older, less relevant content. This does, to a certain extent, mimic the way that animals’ brains work.
Now is a good point to take a step back. I’ve deliberately kept math mostly out of the discussion because, while not that complex, the math is complex enough that it can often obscure rather than elucidate the issues. It should first be noted that creating a compelling model requires a lot of data, and the reality that most organizations face is that they don’t have that much truly complex data. Feature engineering, where you identify the features and the transforms necessary to normalize them, can be a time-consuming task, and one that can only be simplified if the data itself falls into certain types.
Additionally, the need to normalize quite frequently causes contextual loss, especially when the feature in question is a key to another structure. This can create a combinatoric explosion of features that can be better modeled as a graph. This becomes especially a problem because the more features you have, the more likely your features are no longer independent. Consequently, the more likely the model is likely to become non-linear in specific regimes.
One way of thinking about linearity is to consider a two-dimensional surface within a three-dimensional space. If a function is linear, it will be continuous everywhere (such as rippling waves in a pond). If you freeze those waves then draw a line in any direction across them, there will be no points where the line will break and restart at a different level. However, once your vectors are no longer independent, you can have areas that are discontinuous, such as a whirlpool. that flows all the way to the bottom of the pond. Non-linear modeling is far harder because the mathematics moves towards generating fractals, and the ability to model goes right out the window.
This is the realm of deep learning, and even then only so long as you stay in the shallows. Significantly, re-entrancy seems to be a key marker for non-linearity, because non-linear systems create quasi-patterns or levels of abstraction. Reinforcement learning shows signs of this, and it is likely that in order for data scientists to actually develop artificial general intelligence (AGI) systems, we have to allow for “magical” emergent behaviors that are impossible to truly explain. There may also be the hesitant smile of Kurt Goedel at work here, because this expression of mathematics may in fact NOT be explainable, an artifact of Goedel’s Incompleteness theorem.
It is likely that the future of machine learning ultimately will revolve around the ability to reduce feature complexity by modeling inferential relationships via graphs and graph queries. These too are pattern matching algorithms, and they are both much lighter weight and far less computationally intense than attempting to “solve” even linear partial differential equations in ten-thousand dimensions. This does not reduce the value of machine learning, but we need to recognize with these machine-learning toolsets that we are in effect creating on the fly databases with lousy indexing technology.
One final thought: as with any form of modeling, if you ask the wrong questions, then it does not really matter how well the technology works.
Enjoy.