
By Dan Kellett, Director of Data Science, Capital One UK
Over the past few months my blogs have attempted to demystify some of the techniques used by Data Scientists to build models or process large amounts of data. For all the flashy techniques and algorithms this is not where Data Scientists spend 90% of their time. The hard yards of any analysis lies in the data munging.
What is Data Munging?
By Data Munging we mean the process of taking raw data, understanding it, cleaning it and preparing it for analysis or modelling. It is by no means the glamorous part of data science however if done well it plays a more important role in getting to powerful models and insights than what algorithm you use.
First things first
So, you’ve been given a new dataset and are looking to model some behaviors in the data. It is really easy to jump straight in and start running regression or machine learning but this is a mistake. The first step is to really understand the data, starting from a univariate view and slowly building out. Key statistics such as median and tools such as box-and-whisker plots make it easy to build up a picture of the data and help you understand some of the potential issues that may need fixing before you start.

Data types
Understanding what your data types are and what they should be is very important. You may have individual identifiers in your data (for example account numbers). It is quite likely this data will be read in as numeric when you should think of it as character – it is not necessarily the case that account number 002 is more related to account number 001 than account number 101. Similarly, there may be implicit ordering in your characteristic data that would be better converted to an ordinal scale. For example; there is implicit ordering in survey responses (‘agree’, ‘neutral’, ‘disagree’) that you may wish to capture. Finally, if you have dates in your data – enjoy! Being able to manipulate dates is a key skill that once you crack will open up all kinds of opportunities. Again, this all comes down to understanding the context of the data and exploring what you have.
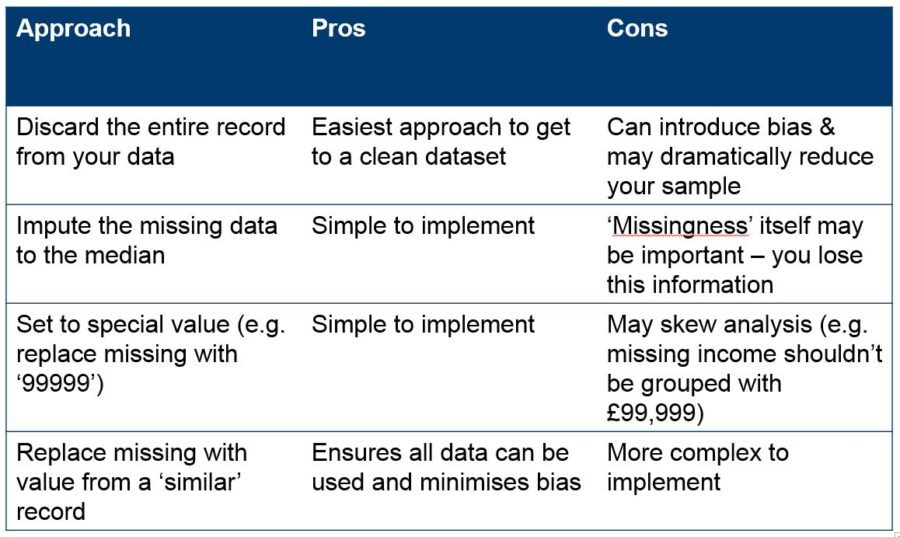
Missing data
It is extremely rare in the real world that you will have complete data. Data elements can be missing for a variety of reasons: not applicable, not asked, errors in the data capture process… The first step with missing data is to understand why the data are missing, only then can you deal with it appropriately. There may be some circumstances where the best thing to do with missing data is to completely discard that observation from your data however you run the very real risk of introducing bias into the analysis/model. A preferred approach is to fill in the holes, either by imputing to an appropriate value (the median as a basic example for continuous data elements) or creating a special value for ‘missing’.
High cardinality
Some categorical data sources have what we call high cardinality –a large number of discrete values (for example postcode or occupation). Highly cardinal variables can be troublesome when carrying out analysis or model building as you run the risk of overfitting to small sample sizes. Expert knowledge around the data is really important as it may suggest a way to ‘group up’ the values. For example; if you know about the geographical boundaries of the UK you can suggest better ways to group postcode beyond just the postal area. The below picture shows an example; based on the postcodes you may group NG20 with NG23 postcodes however it may make more sense geographically to group NG23 with LN6. Expert knowledge is not always available and in these cases you may want to use more data driven approaches to group values such as clustering.

Outliers
Not every piece of data fits a standard Normal distribution. Sometimes your data will include extreme values that can potential bias results. Think about income for example; the average value can be hugely influenced if you happen to have a couple of billionaires in your sample (as an aside it is always better to look at median and percentiles than mean). Understanding the range of your data and capping and flooring the data appropriately is key to effectively modelling it.
In the above I have tried to highlight some of the important areas to consider when preparing data for analysis. This is by no means exhaustive but the key message is: if you don’t know your data inside and out, how can you trust any conclusions you make?
Read my previous blogs on: Text Mining, Logistic Regression, Markov Chains, Trees or Neural Networks
Further reading: