
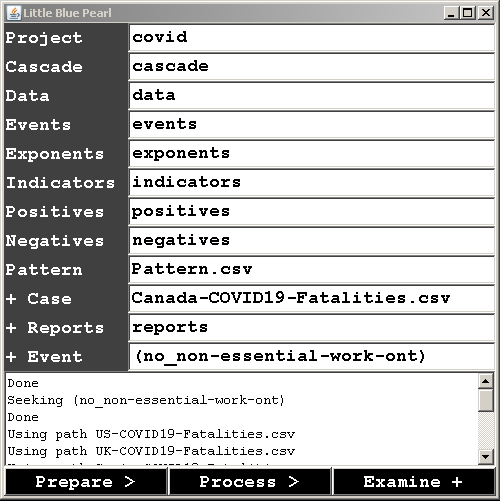
Little Blue Pearl – named after our planet – has kept me occupied for several days during my 14-day Coronavirus isolation. It is fully functional although I suppose it needs a makeover in terms of its appearance. Like a child after summer break, this is going to be my show-and-tell. LBP is designed to process the pandemic data in a particular manner focusing mostly on the number of fatalities.
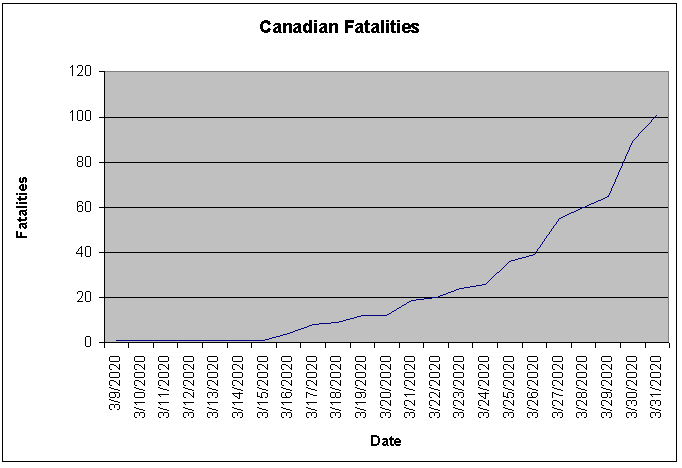
I created LBP because I believe that the new Coronavirus and many other types of dangerous diseases are here to stay. I will make my contribution to prop up our species in one of the few ways I know how. I begin with a normal chart of fatalities. The image below shows the chart for Canada.
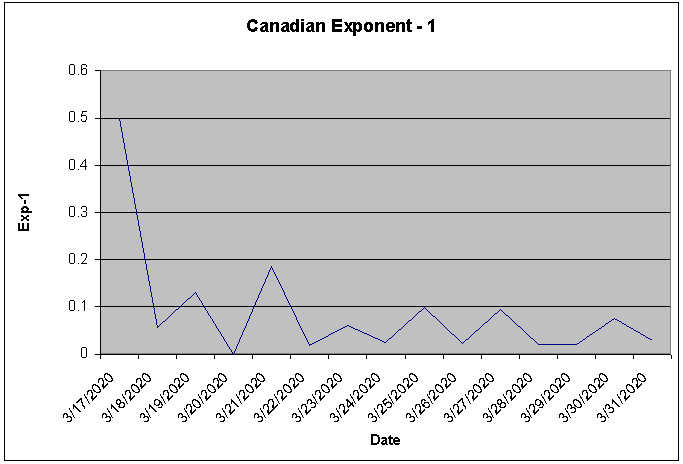
LBP first converts the fatality data into a format that can be more easily accessed by a computer algorithm; basically, this means keeping the activity confined within predictable boundaries. I use a metric that I call the Exp-1, which I wrote about actually on the same day that I developed it.
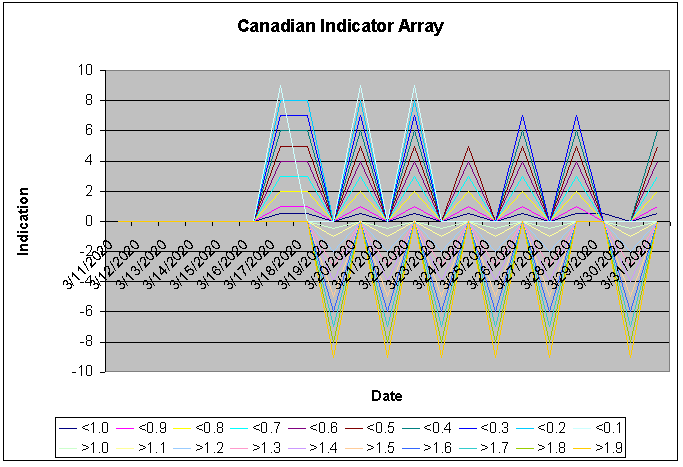
To demonstrate the bounded nature of the converted data, consider the next chart containing triggers using fixed boundaries – as presented on the legend. On this chart – also generated by LBP – beneficial developments are indicated as more and bigger bumps appear on the top. The opposite is true if the bumps are on the bottom.
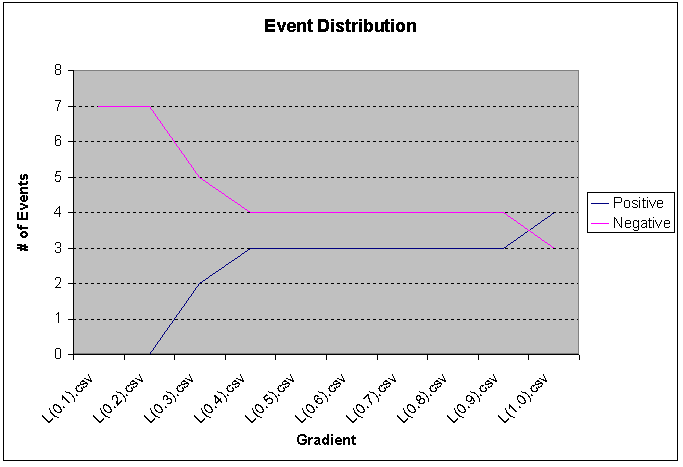
LBP’s primary mission is to determine the impacts of qualitative events on the quantitative metric. On the gradient of the chart below, the greatest amount of benefit occurs when the pattern is on the left. The particular event in question therefore seems associated with minimal benefit.
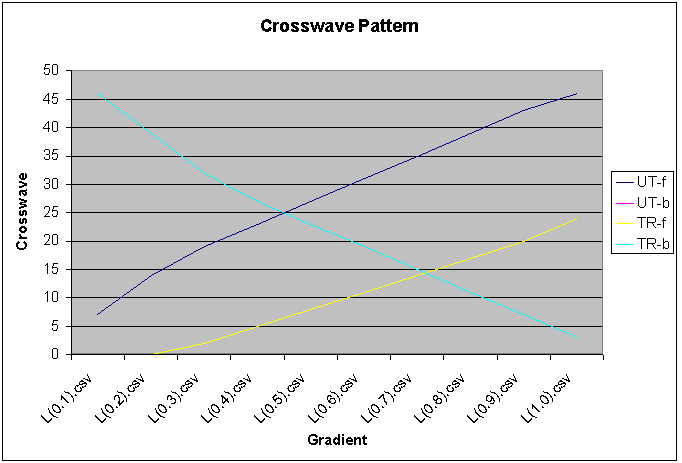
The crosswave pattern chart attempts to show relative benefit: e.g. are we better or worse off implementing or having the event? The chart shows that based on the data available, it seems we were better off not implementing or having the event. The legend explains the chart to some extent: UT-f = untreated forward; UT-b = untreated backwards; TR-f = treated forward; and TR-b = treated backwards. I have written about the crosswave differential over the years. I will just note at this point that it has been tested using controlled simulations.
The more specific or focused the data and events, the easier it is to determine and especially explain the connection. The particular event in this case is the stoppage of unnecessary business in Ontario. It should be noted that the stats for the entire country are fairly disassociated from regional and provincial realities: i.e. it might be unfair to evaluate the impacts of the stoppage since the metric is national rather than provincial. I am aware also that many fatalities have been connected to old age homes. It is not for me to question the exact reasons for the outcomes. The LBP merely points to the lack of evidence of effectiveness and possible signs to the contrary.
Possible Reasons for Lack of Effectiveness
There is no reason to question the underlying principle: social distancing is likely to prevent the transmission of disease. However, the event that I used is not about social distancing per se but rather the stoppage of non-essential business, which probably has the effect of directing people towards those operations that are considered essential. Consequently, more people – including those are infected – gravitate towards these essential businesses. Infected individuals (asymptomatic or not) find themselves with few options; this might contribute to the accidental transmission of the disease through these businesses. The so-called incubator effect might therefore not simply be a spatial phenomenon per se but also logistical. This is only speculation at this point given the absence of both quantitative metrics and qualitative event data.
An institutional solution – such halting non-essential business – can be problematic if the events connected to it cannot be easily associated with the resulting metrics. LBP enables a systematic approach to connect the dots. LBP takes line-by-line event data structured as follows for each line: (this_is_my_event). Theoretically, the number of lines is unimportant. It is therefore possible to incorporate a large amount of non-parametric or category-type data: e.g. codes associated with quality control and compliance checklists. If any jurisdiction would be interested in providing me with event data associated with their Coronavirus experience, I am offering to periodically review their distributions for free. This is meant to help me further develop LBP.