

I think one of the most important data consumption developments in the age of Big Data and AI is the concept of a Data Product.
Data Products are a category of domain-infused, AI/ML-powered apps designed to help non-technical users manage data and analytics-intensive operations to achieve specific, meaningful, and relevant business outcomes.
Some key aspects of Data Products:
- Data Products are the packaging of 4 critical disciplines – Data Management, Data Science, Application Development, and Customer Experience – with AI / ML that can continuously learn and adapt to deliver high-value business or operational outcomes.
- Data Products represent a semi-autonomous data and analytics (economic) asset that can be shared, reused, and continuously refined…with minimal human intervention.
- Data Products can be orchestrated to address complex value chain processes when the Data Products are built on a common architecture that facilitates the sharing, reuse, and continuous refinement of the enterprise’s data, KPIs, features, and ML models.
This blog will introduce the Data Product Development Canvas to guide Data Product development. We will review how to build a series of Data Products to automate and optimize the Order-to-Case value chain process. But first, a quick review of Customer Journey Maps.
Customer Journey Map is a design tool for identifying the decisions (actions), KPIs (to measure decision effectiveness), gains (benefits), and pains (impediments) within the context of a customer “journey” to achieve a specific outcome (Figure 1).
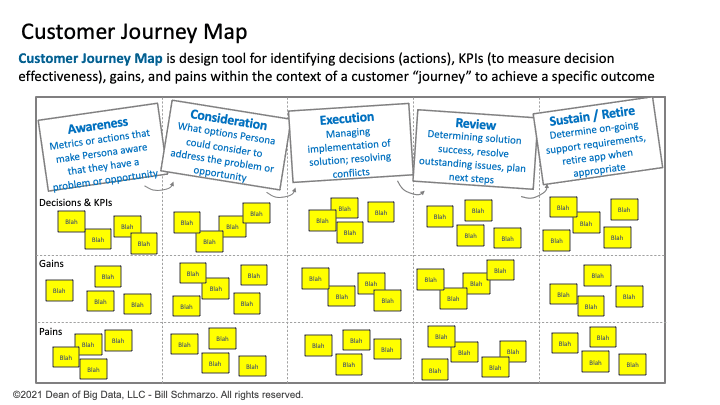
Figure 1: Customer Journey Map
The Customer Journey Map is a marvelous design tool that forces developers and designers to “walk in the shoes” of your targeted stakeholders or personas to understand intimately their process in achieving a specific outcome – from outcome awareness and inspiration to outcome attainment and sustainability. Now, let’s apply the Customer Journey Map to an Order-to-Cash (OTC) value chain example.
The Order-to-Cash (OTC) is an enterprise-wide value chain process that crosses business units in the process of receiving and fulfilling customers’ requests for goods or services. Supporting the Order-to-Cash value chain requires the individual Business Units to capture and manage data that may not be necessary for optimizing their own operations but are critical for optimizing upstream and downstream operations including Order Management, Credit Management, Order Fulfillment, Order Shipping, Customer Invoicing, Accounts Receivable, and Payments Collections and Reconciliation (Figure 2).
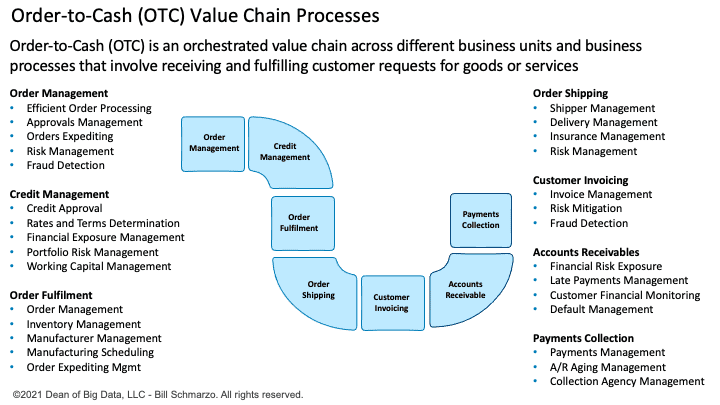
Figure 2: Key Business Unit Tasks Supporting the Order-to-Cash Cycle
But even beyond the immediate OTC journey, there are enterprise upstream and downstream data and analytic requirements that need to be addressed (Figure 3). For example:
- Optimizing the OTC process has upstream value chain dependencies (Product Development, Marketing, Sales) to capture the necessary data and create analytics that support optimizing the OTC process.
- There are downstream value chain obligations (Customer Support, Services, Account Management) that require the OTC value chain process to capture data and create analytics that are key to optimizing downstream value chain processes.
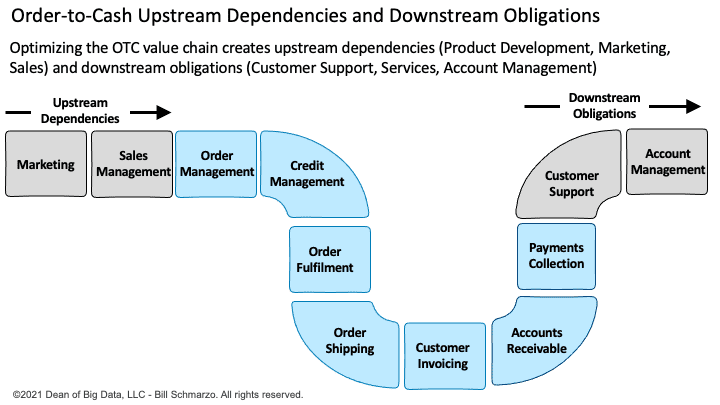
Figure 3: Order-to-Cash Journey Map with Upstream Dependencies and Downstream Obligations
An enterprise is more than just the sum of its business units. The value of an enterprise is its ability to synergize across business units to uncover analytic insights (predicted behavioral and performance propensities) that can optimize business unit performance vis-à-vis the enterprise mission. For example, we could create enterprise-level analytic scores – Customer Potential Lifetime Value, Customer Credit Risk, and Customer Financial Health – that could be used by each business units to optimize their individual tasks and outcomes (Figure 4).
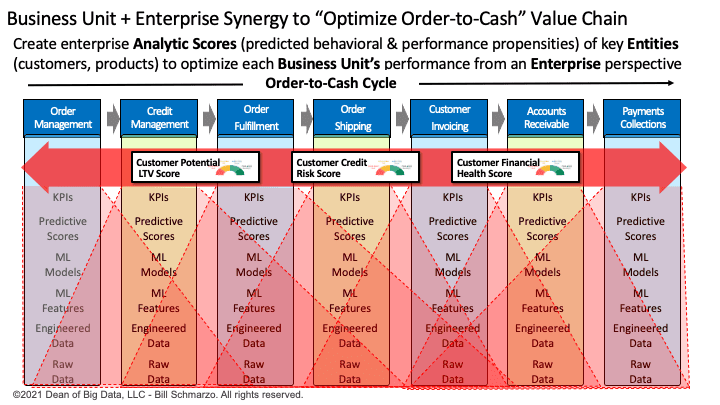
Figure 4: “Using Stakeholder Journey Maps to Re-invent, not Just Optimize, Your Business Processes”
Data Product Development Canvas
The Data Product Development Canvas is an easy-to-comprehend tool for facilitating business and data team collaboration in triaging the targeted business problem and identifying the data and analytic components for the development of a Data Product to achieve a specific business outcome.
I created the Data Product Development Canvas in Figure 5 to help organizations capture the data and analytic capabilities necessary to create a “Data Product” that achieves a specific business outcome.
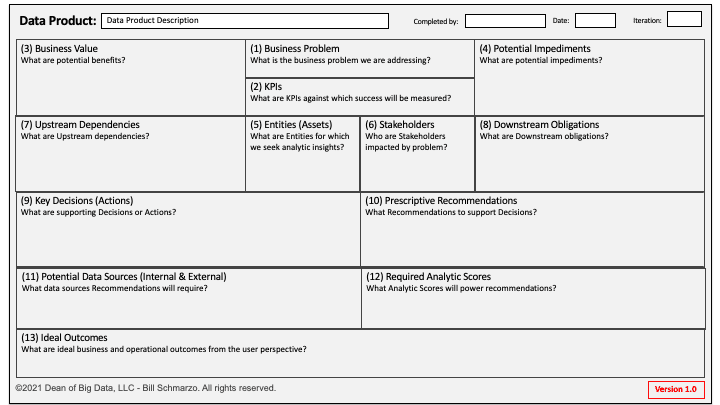
Figure 5: Data Product Development Canvas
Here is a quick review of the Data Product Development Canvas panels in Figure 5:
- What is the Business Problem that we are trying to solve and why is this problem important to the organization and its customers?
- What are the KPIs and metrics against which business problem progress will be measured and success will be judged?
- What are the potential Benefits from addressing this business problem? Be sure to explore potential benefits from multiple perspectives including financial, operational, customer, employee, partner, environmental, and societal.
- What are the potential implementation and execution Impediments? These should cover people, processes, technologies, and culture.
- What are the key Business Entities (human or device) for which we seek to uncover and codify their predicted behavioral and performance propensities?
- Who are the Stakeholders or constituents that either impact or are impacted by the business problem? Be sure to take a broad, ecosystem view of the potential stakeholders.
- What are the Upstream process dependencies? That is, identifying the upstream activities from other business units or departments that are required to produce the raw materials that feed into the Data Product.
- What are the Downstream process obligations? That is, identify those post-production activities for which the Data Product is required to provide downstream data, features, and analytics.
- What are the supporting Actions or Decisions (Use Cases) and KPIs against which to measure decision effectiveness?
- What prescriptive Recommendations are needed to support the key decisions? That is, what recommendations need to be delivered to the different stakeholders to help them optimize their decisions.
- What are the Data Sources and data elements required to power the Recommendations? This could include data generated by that business unit, data generated by downstream business units, as well as external and third-party data sources.
- What Analytic Scores are needed to power the prescriptive recommendations? Note: be sure to explore the Analytic Scores that other business units and data products might have already created (credit risk score, customer lifetime value score, financial fraud score).
- What are the ideal outcomes that the Data Product enables from a user perspective? This is the fun part, in brainstorming what good looks like with respect to using the Data Product.
Note: What this design canvas is missing are people to review, test, and share feedback so that we can update the canvas as a guide for delivering meaningful, relevant, and usable outcomes. If you would like a PowerPoint version of the canvas, just message me.
Summary: Driving Organizational Data Product Alignment? SPECTRED!
A successful Data Products strategy is dependent upon an enterprise strategy that seeks to capture, share, reuse and continuously refine the enterprise’s data and analytic (economic) assets no matter where that data may originate.
The challenge: who has responsibility from an enterprise perspective in the definition, creation, management, and continuous refinement of these Data Product and the underlying data and analytic assets?
The organization needs a centralized data management and governance council that owns synergizing and scaling data and analytics value creation through a collaborative enterprise AND business unit view of identifying, re-using, refining, enforcing, and exploiting the organization’s data and analytic assets.
I’d recommend creating SPECTRED – the “Special Executive for Collaboration, Transparency, Reuse, and Economics of Data” – and modeling that organization after the SPECTRE organization featured in the James Bond movies, which was a very effective organization in driving organizational compliance and adherence to the organizational mission (Figure 6).
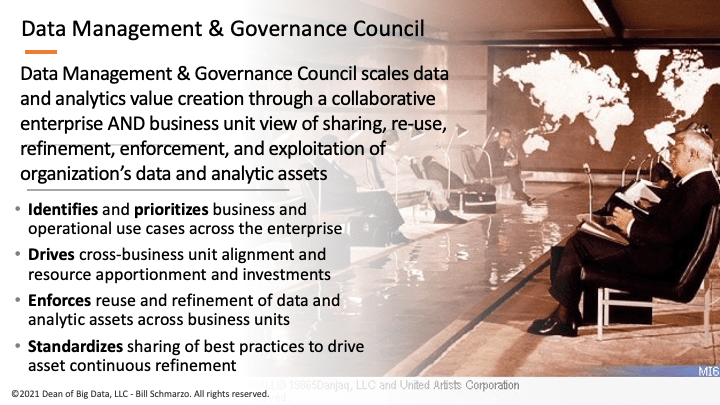
Figure 6: SPECTRE Data Management and Governance Council
Someone needs to own the enterprise view and have the ruthless authority to drive adherence and compliance and knock down walls to make stuff happen!
)