
Big data is all the rage, but simply collecting it won’t help much. These data visualization tools help you make sense of it all.
The rise of big data has ushered in the era of data-driven decision-making.
Vast volumes of data constantly flowing in from multiple sources contain valuable insights that can lead to better business decisions and competitive advantage. The challenge for businesses is to spend less time setting up, collecting, and organizing data, and more time making decisions based on the insights that the data holds.
That’s where data visualization tools come in, giving business leaders and decision makers a creative and intuitive way to access data, discover hidden insights and take strategic action.
If you’ve been looking for new and better ways to extract actionable insights from your business data, here are 5 data visualization platforms to help you get the job done.
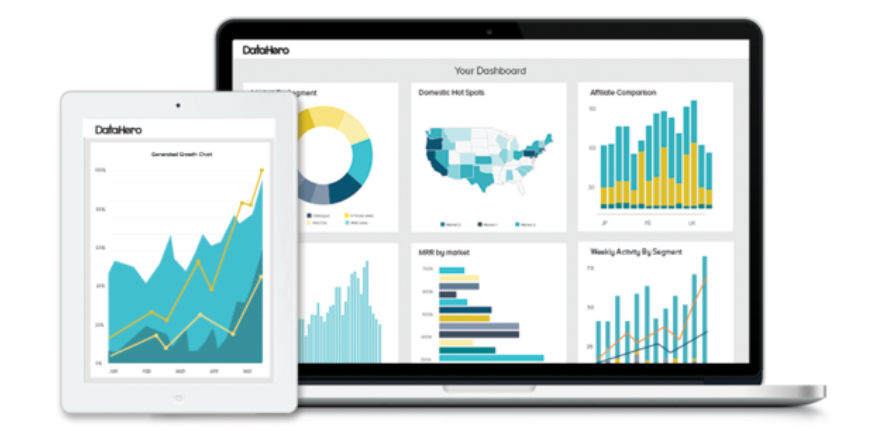
1. DataHero (Cloud Service Analytics)
Create dashboards, charts and interactives with your business data and gain actionable real-time insights using the DataHero data visualization tool. Whether your data is online, in excel or in cloud storage drives, DataHero can handle it.
Need a marketing dashboard? DataHero allows you to combine data visualizations from different services into a single dashboard that makes viewing and sharing easy. When it comes to streamlining different data sources and implementing them into your workflow, DataHero’s drag-and-drop feature simplifies the process. And since DataHero connects to Hubspot, Zendesk, and dozens of other popular apps, using your data with the applications that you prefer has never been easier.
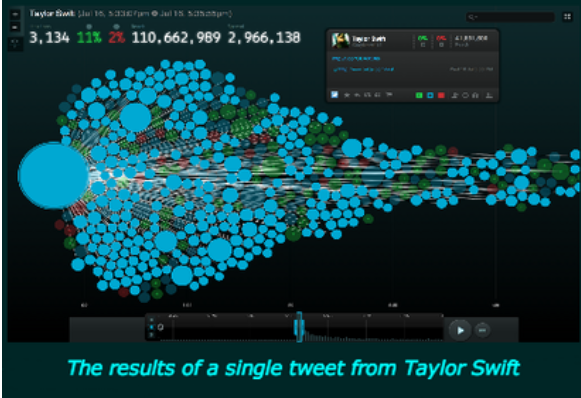
2. Nuvi (Social Analytics)
In this age of social media, sites such as Facebook, Twitter, Instagram, and YouTube allow your company to communicate and engage with customers like never before. These sites also give customers a powerful public forum for singing your company’s praises or posting negative comments.
With so much at stake it’s critical to know what’s happening on social media for good or bad, and Nuvi is a tool that lets you do that. Nuvi’s proprietary “Bubble Stream” gives you real time visualizations of social interactions—who’s saying what to whom and where—all in real time. As a result, you’ll discover patterns and insights within social conversations that were previously hidden, all of which you can use to make those better and faster decisions that lead to competitive advantage.
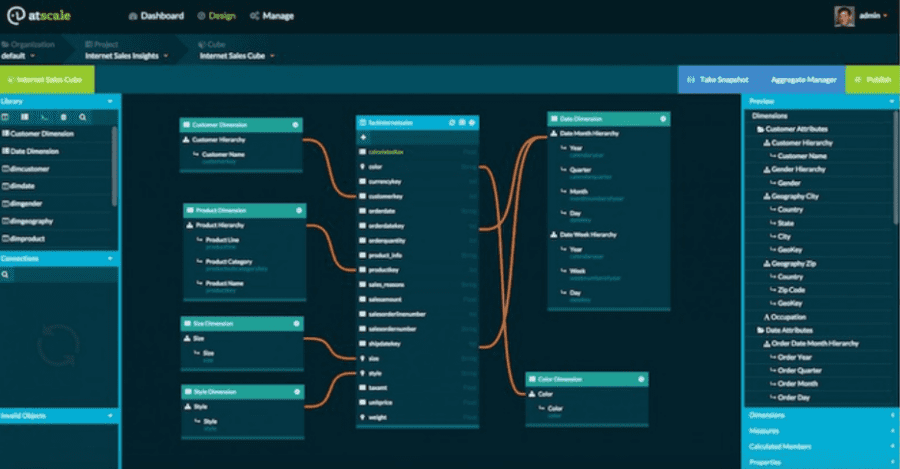
3. AtScale (Big Data Analytics for the Masses)
Big data analytics platforms, such as open source Hadoop are powerful tools for extracting insights from massive amounts of unstructured data. However, a successful Hadoop implementation typically requires a team of skilled data scientists, making it prohibitive for all but large and well-funded organizations.
Thanks to AtScale’s BI on Hadoop integration, among many other integration options, now the every day layman can perform what used to be a highly specialized and expensive task. Atscale is a software platform that makes data stored within Hadoop accessible within Business Intelligence (BI) applications, smaller organizations without skilled analysts can leverage Hadoop insights as well.
By transforming Hadoop into a scalable, enterprise-grade Online Analytical Processing Server (OLAP), AtScale allows you and your team to carry out interactive multi-dimensional analysis on all of your organization’s Hadoop data at lightning speed, using the BI and data visualization tools—Excel, Tableau Software, QlikView—that you are already familiar with.
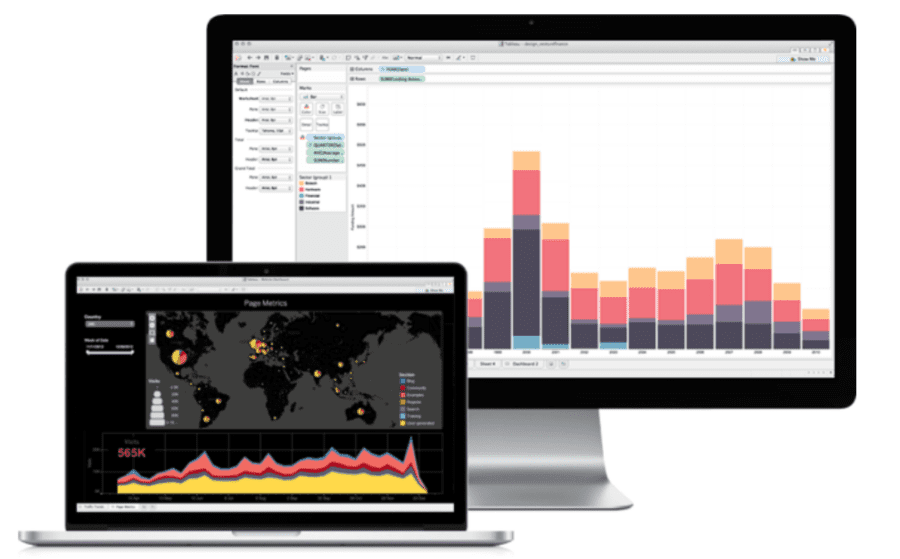
4. Tableau Desktop and Server (Data Visualization and Sharing)
Gaining actionable insights through data visualization is one thing. But the ability to share those insights rapidly and interactively across your entire organization is quite another.
Tableau Desktop and Tableau Server allow you to do both. Tableau Desktop is designed to help you visualize, analyze and understand data. From creating and formatting reports and charts and putting them together as a dashboard, Tableau Desktop takes care of it all. And when it comes to streamlining and integrating data from multiple sources, Tableau simplifies the process by bringing different data sets together on the same chart.
Tableau’s unique “Show Me” function makes it easier and quicker. Just import the data, choose a few fields, and press “Show Me” to automatically generate rich, colorful and intuitive visualizations. When you’re ready to share your insights collaboratively, use Tableau Server to upload your reports and data and deliver them to your entire organization via live interactive dashboards on a web browser or mobile device.
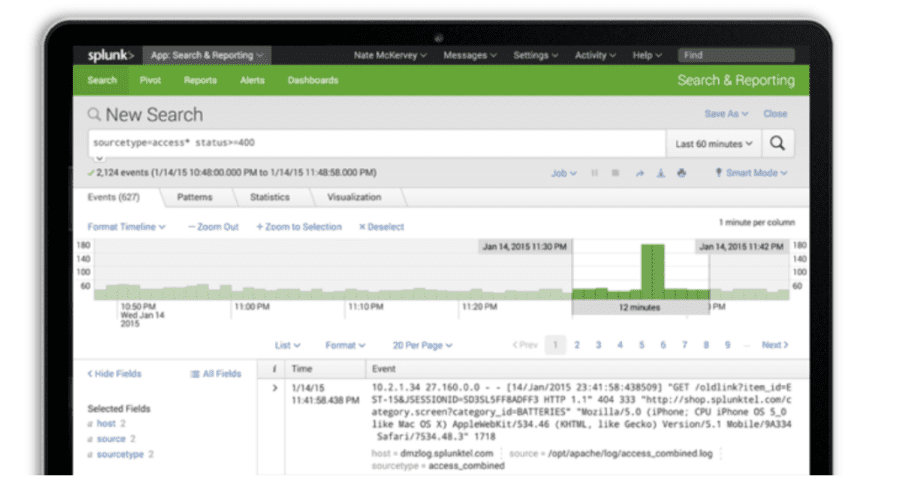
5. Big Data Tools: Splunk (Text Indexing)
Splunk is a unique monitoring tool that can be used to collect big data sets—typically machine data from any source in your infrastructure and of any format—add it to an intelligent, searchable index, and offer real time visibility and insights about your organization’s operations.
Splunk is well suited for monitoring the availability and performance of IT systems, making sure that hardware, software, applications and individual components are working together optimally from the beginning to the end of transactions. To help you and your team get a grasp on specific information within the system, Splunk offers free customizable apps designed to make that information instantly useable.
In today’s business landscape, competitive edge comes from making faster and better decisions. The above 5 platforms can be powerful and effective tools for reducing time to insight and optimizing data-driven decisions and strategies.