
Organizations across industries are adopting graph analytics to reinforce their anti-fraud programs. In this post, we examine three types of fraud graph analytics can help investigators combat: insurance fraud, credit card fraud, VAT fraud.
Detecting fraud is about connecting the dots
In many areas, fraud investigators have at their disposal large datasets in which clues are hidden. These clues are left behind by criminals who, on their side, try to hide their activity behind layers of more or less intricate schemes. To unveil illegal activities, investigators have to connect the pieces of the puzzle to discover evidence of wrongdoing.
Most anti-fraud applications are able to connect simple data points together to detect suspicious behaviors: an IP address to a user, withdrawal activities to a place of residence, or a loan request history to a client.
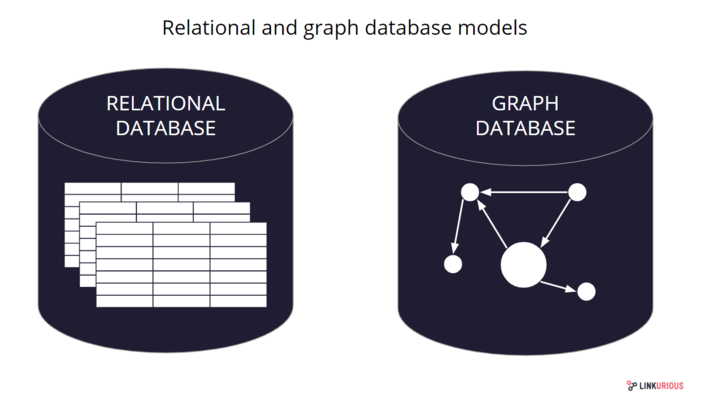
But these applications fall short on more complex analysis that would imply several levels of relationships or data types. This is mostly due to the technology on which these applications often rely and the data silos it creates. The relational databases that emerged in the ’80s are efficient at storing and analyzing tabular data but their underlying data model makes it difficult to connect data scattered across multiple tables.
The graph databases we’ve seen emerge in the recent years are designed for this purpose. Their data model is particularly well-suited to store and to organize data where connections are as important as individual data points. Connections are stored and indexed as first-class citizens, making it an interesting model for investigations in which you need to connect the dots. In this post, we review three common fraud schemes and see how a graph approach can help investigators defeat them.
3 types of fraud graph analytics can combat
1) Insurance fraud
Insurance fraud encompasses any act committed in the intent of defrauding an assurance process. It ranges from staged car accidents to faked deaths or exaggerated property damages. The FBI estimates that insurance fraud cost $40 billion per year in the U.S.
As an example, people frequently team up and put together fake road traffic accident (RTA) claims, in which they report hard-to-disprove, light, personal injuries. Those fraud rings involve several criminal playing the various roles of conductors, passengers, witnesses and even doctors that certify injuries, or accomplice lawyers that file the claim.
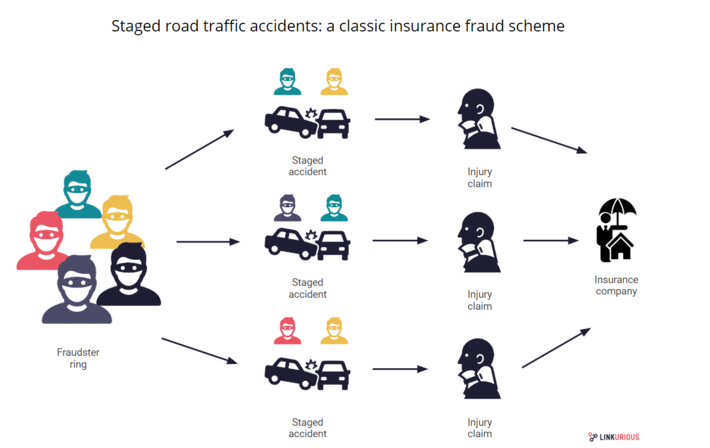
There are too many claims filed every day for insurance analysts to analyze manually. Fraud investigation units have to rely on simple business rules to identify suspicious claims. But if the fraudsters made sure to avoid red flag case elements (unusual injury, recently purchased insurance policy, low velocity but significant injury etc) there is a chance they will go undetected and repeat the scheme.
This is where graph technology steps in. The graph approach brings data from various sources under a common model, so investigators can look at all the data at the same time, instead of isolated data silos. And this is exactly what they need because in these situations, what often gives away the fraudsters is abnormal connections to other elements.
These suspicious connections could be that the witness’s wife is connected to two similar cases, or that the doctor’s phone number is the same as the one of a conductor involved in another RTA claims, etc. Graph visualization and analysis platforms like Linkurious Enterprise allow investigators to pick up suspicious signs faster. They get a better understanding of the “big picture” and can identify abnormal connections to detect insurance fraud.
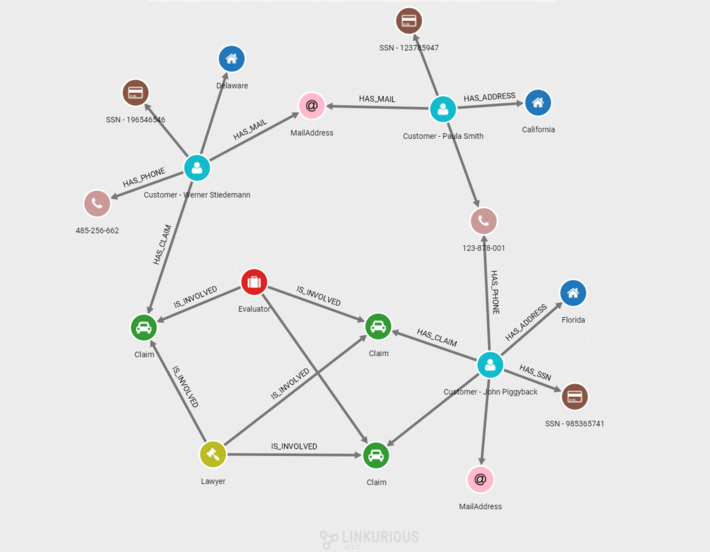
Above is an example graph visualization where we can identify one of those abnormal patterns that indicate insurance fraud of staged car accidents: Two customers (blue nodes) filed three claims (green nodes). We can identify a network of three customers connected through personal information such as phone (brown nodes), email (pink nodes) with the same lawyer (green node) involved every time. It is likely they are recycling stolen or fake identity to file fraudulent claims.
2) Payment card fraud
Payment card fraud takes the form of criminals getting ahold of credit card information and proceeding to create unauthorized transactions. Card-present scenarios, in which criminals use a stolen or counterfeit credit card at an ATM or at the point-of-sale (POS) terminal of a physical store, affected 45,8 million cards in the U.S in 2018. Despite a massive migration to the safer chip-based card, stolen credit card fraud is still a major issue.
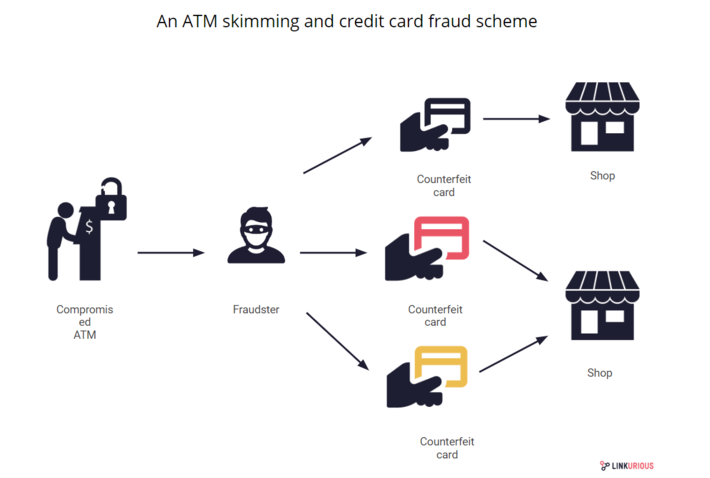
In a commonly encountered situation, a criminal proceeds the following way:
- set up skimming devices at ATM or gas pump to steal the details stored in card’s magnetic stripes;
- replicate the stolen card information into a counterfeit card;
- use to stolen cards to withdraw money at ATM, buy goods or gift cards at shops;
- cardholders notice unusual activity on their bank account and notify the authority.
These situations are a perfect case for graph technology. While traditional technologies will hardly allow you to create a ‘big picture’ of heterogeneous data, the graph approach lets you collect the data in a model linking together: cardholders, transactions, terminals, and locations.
This way, when authorities are confronted with a surge of card-present fraud cases in a given region, graph technology can help identify the common point of compromise by highlighting the common links within the various reported cases, no matter how large the dataset is. Credit card fraud is thus another type of fraud graph analytics can help detect and fight.
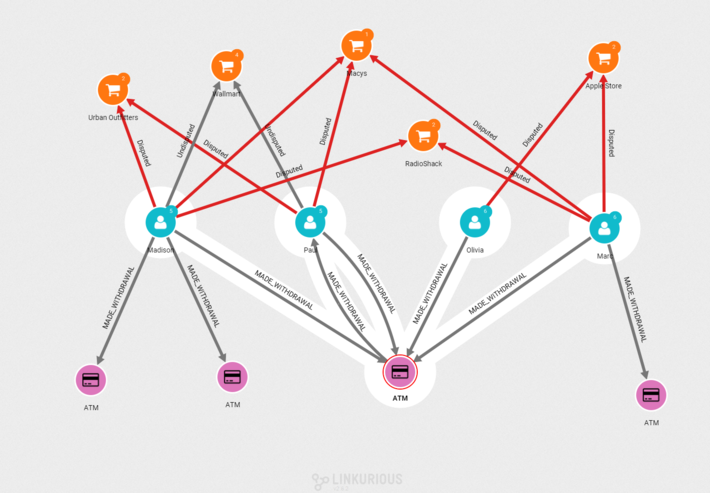
Above is an example of a graph visualization to identify a common point of compromise: Clients (blue nodes) report fraudulent purchases (orange nodes). We can identify through connections the common ATM (purple) where they made a withdrawal before the card was compromised.
3) VAT fraud
Carousel fraud, also known as the missing trader, or VAT fraud, is the theft of VAT collected on the sale of goods initially bought VAT-free in another jurisdiction. This scheme is difficult to identify in time and losses can be massive as recent cases have shown.
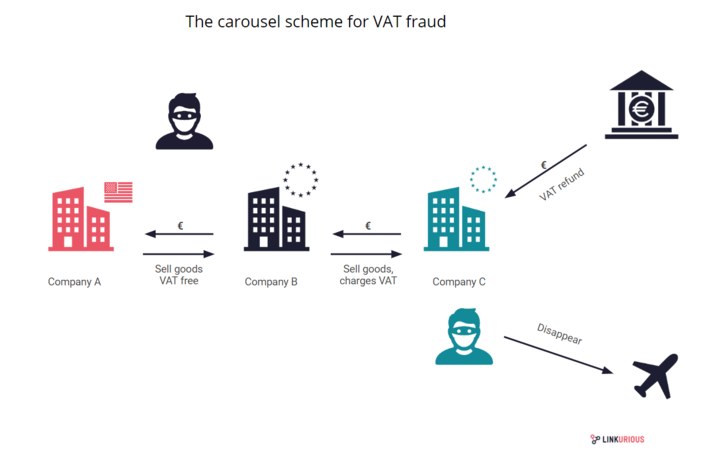
In 2018, a single VAT fraud ring cost more than 60 million euros to the European economy. The criminal organization was selling products online through a wide network of shell companies and producing false invoices to perform VAT fraud. Generally, this is how the carousel works:
- Company A sells the goods company B VAT-free
- Company B sells the goods to company C, charging the VAT
- Company C sells the goods and claims a VAT refund to the tax agency of country A
Those schemes are intricate and transactions quickly come after one after another to avoid raising suspicion. To make sense of the layers behind which criminals hide, investigators need an overview of the situation. Once again, graph technology can help bring together various data types to get a better understand of the financial context.
Then, platforms like Linkurious Enterprise provide support for pattern finding activity, leveraging the flexible query semantic of graph databases. Investigators can search across vast data collections for patterns indicative of the carousel: for example multiple transactions occurring in a short amount of time between companies from two different countries with a newly created intermediary company. From there, investigators can monitor flagged patterns and assess the existence of potential carousel fraud.
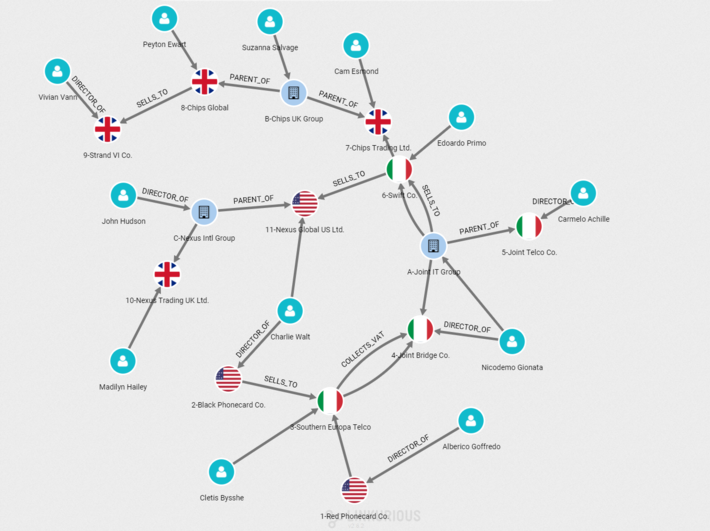
Above is an example of a visualization to identify chains of transactions in VAT fraud: Companies (blue nodes) and their parent organizations (flags nodes) sell goods VAT-free and collect back VAT through complex layers of sales between EU and non-EU countries.
Today, organizations use graph technology to fight fraud across activity sectors: insurance, banking, law enforcement or financial administrations. It is a complementary approach to traditional statistical and relational technologies because it gives the opportunity to look for clues within data connections, which is where the value often lies when it comes to fraud.
(Initially published on linkurio.us blog)