
Data Science is a broad discipline, even though the concept is recent, every day is evolving. According to Berkeley School of Information, the Data Science Life Cycle has five stages, this stages are not exclusive from one another. These five stages are Data Capture, Data Maintain, Data Process, Data Analysis and Data Communication. The latter is the most important activity in businesses. It is where we deliver Data Visualizations, Data Reports, Business Intelligence and Decision Making. Most often, all the time spent in the remaining stages will end up in making decisions, based on the whole process, so we can constantly improve.
When trying to solve a data science problem, there are plenty of techniques you can use to puzzle it out; for example, support vector machines (SVM), decision trees, logistic regression, neural networks and many others. The big problem is that almost all of them are black boxes, you probably know what the algorithm is doing, hopefully, but your co-workers or random ordinary people might not understand the intuition behind those complex models. So as a data scientist you should not only extract value from data but also being able to translate results into solutions and then communicate that. Decision rules will help us extract clear conclusions on how the algorithm is making decisions. So we can later on make decision based on that.
We can extract decision rules using Python and some well-known libraries. We are going to use an HR dataset provided by Kaggle contest. The features of the dataset are satisfaction level, last evaluation, number project, average monthly hours, time spend company, Work accident, left, promotion last 5 years, sales, and salary. “Left” variable will be our target. Basically we want two extract two things from our algorithm, the prediction of our target variable, in this case whether the employee leaved or not and why they are leaving. What features increases attrition risk? Those features will be the rest of the dataset, the variables that we will use to feed the decision tree. Basically, the root node is our entire dataset that will later be splitted based on our selected strategy like Gini Index, Chi-square, entropy or variance reduction. The dataset has 10 columns and 14,999 observations. 2 features are object data types, to work with scikit-learn we will transform to dummies those features, using pandas. We will use a train and a test data; the test will have 35% of the whole data.
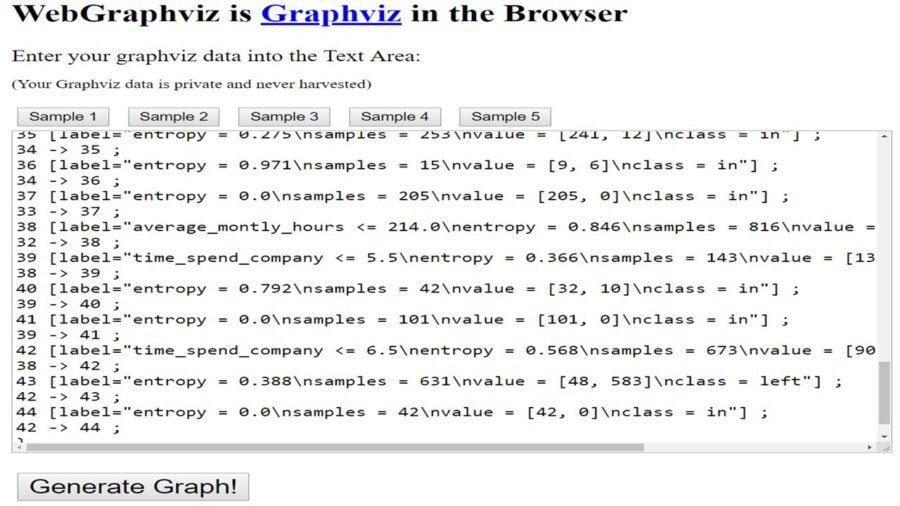 To make the tree easier to interpret we are going to set the maximum depth of the tree to 5, so we can have more representative samples from all nodes. The score stills being pretty good with 0.97, and we can generalize the rules provided by the tree more easily. Like in everything, we will face the trade-off, between a bigger precision and an easier to interpret algorithm. Once we call all the methods we will get a dot file, we can open that file with a text processor. Do not worry, it is not that complicated. Essentially, is a bunch of steps to build a visual decision tree, you can do that with python as well. But it is even easier to visualize all that code, just using the web! You can use webgraphviz or any other tool.
You will automatically get a decision tree. If it is to robust, probably you might consider moving the parameters of the algorithm.
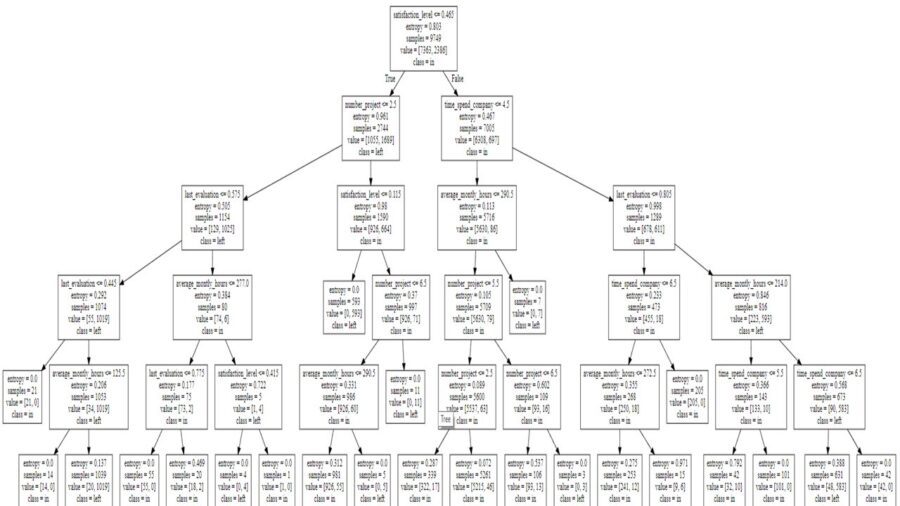 Done! we are going to extract the rules from the tree. First some concepts:
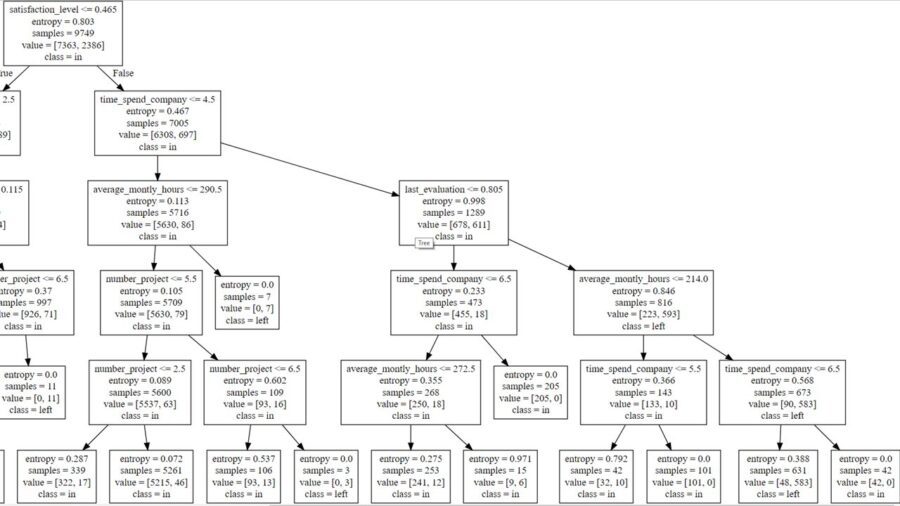
- Entropy: Measure of unpredictability of information content in other words is how much information we learn on average from one instance. We are looking for zero when speaking about entropy. Zero means there is only one label in the node.
- Samples: The amount of observations in each node.
- Value: The amount of observations in each label. The one on the left is the zero value and the one on the right is the number 1. In this case in and left respectively.
To extract decision rules from our tree we must consider the nodes at the end (end nodes) and then all the way up until the root node (backward) or vice versa (forward). It is important to cover all the branch. Otherwise our decisions will be less accurate.  To extract relevant conclusions, we must ponder those end nodes with tons of observations no matter they are 0 or 1 (in or left). The most relevant include 1039, 981, 5261, 631 samples.
- If average month worked hours are more than 126 hours and the result on the last evaluation is between 0.445 and 0.574, and he or she has less than 2 projects and a satisfaction level less than 0.465 he or she will be more inclined to leave the organization.

- If satisfaction level of the workers is less than 0.465 and the average monthly worked hours are less than 290 hours and finally the number of projects is between 3 and 6, then the employee will move towards staying in the organization.
- If the worker has between 3 and 5 projects and worked less than 290 hours and has less than 4 years in the organization and a satisfaction level more than 0.465 they will be more inclined to stay in the company.
- If the time spent in years in the organization is between 5 and 7 and a last evaluation scoring more than 0.8, working more than 214 hours on average a month, having a satisfaction level more than 0.46 they will be prone to leave the company.
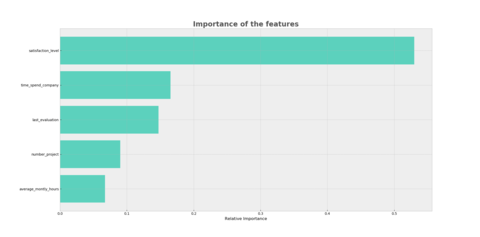 Finally, Plotting the importance of the features might be a good idea. This can give us a clue on what a worker values the most or at least worries the most. You can obtain this information through the feature_importances_ parameter. And then you just have to plot it.
Definitely satisfaction level is very importan when making a decision, also the years in the company and the last evaluation, last but not least the number of projects and the monthly hours working. We can say that accidents in the organization, promotions, salary and position are irrelevant.
In conclusion, this is a decision rules extraction from the HR Kaggle contest. This means that the datset is a simulation, it is not a real world compay data base extraction. Having more data can be benefitial. Having a satisfaction index was very helpful, as a human resource manager probably you will not do all this process if you have a very relevant satisfaction index, it all depends on your policies and management philosophies. It will be important to build multi-disciplinary teams, in order to analize from all perspectives the decision rules you got from this analysis. This algorithms are not panaceas and will not definetly be your final decisions, you have to set policies based on all the information provided by your analysis.
Please feel free to share your experiences using machine learning algorithms in a human resources management context, it would be great to hear from you.