
I love maps. It’s not just a nerdy thing. Map are very helpful visualization tools for a lot of questions from business. Of course, there are number of standard BI tools which can produce maps as well, like Tableau. My experience is that the coded ones offer more customization options. Especially when it comes to destinations/cities/villages, which are not big (or well-known) or when the data is not “very” clean (e.g. same city written in a different way), if you have to preprocess data at all. I deal with all of these and more. Therefore, I prefer python to create maps.
Before you can start with a map, read the data and du transformation and cleansing, if needed. Get your standard preamble in any case (if you do not have your own, you take mine from one of the previous posts). Then, proceed with map preamble:
import folium # basic leaflet map start
from folium.plugins import MarkerCluster #you need this to cluster your destionations
from folium.plugins import MiniMap #this is if you want to include minimap to the big map
from folium import plugins
from folium import FeatureGroup #for feature customazation
from IPython.core.display import HTML # to add html
import branca.element # for the features
from folium.plugins import HeatMap # if you want to create a heatmap
Step 1: create the basis layout
map1= folium.Map(location=[10,20], zoom_start=2, tiles=’http://tile.stamen.com/toner-lite/{z}/{x}/{y}.png’,attr=”Dr.Katharina Glass”)
Let’s take the closer look at the options in brackets.
location=[10,20], zoom_start=2 Here you define where does your map start. Start location make be the average over all your destination or you may define a specific point. Keep in mind this location is the visual middle of the map. With the zoom_start you define how far you would like to zoom in or out.
Tiles is your layout. As folium web page says, “the library has a number of built-in tilesets from OpenStreetMap, Mapbox, and Stamen, and supports custom tilesets with Mapbox or Cloudmade API keys.” I applied above black-and-white layout I like currently the most. Be always aware of what your customer wants or expects to see in the end. If you would work with colors to highlight tags, then discreet colors for the background are a good idea.
attr=”Dr.Katharina Glass” Add custom stuff, like your name or department name, etc.
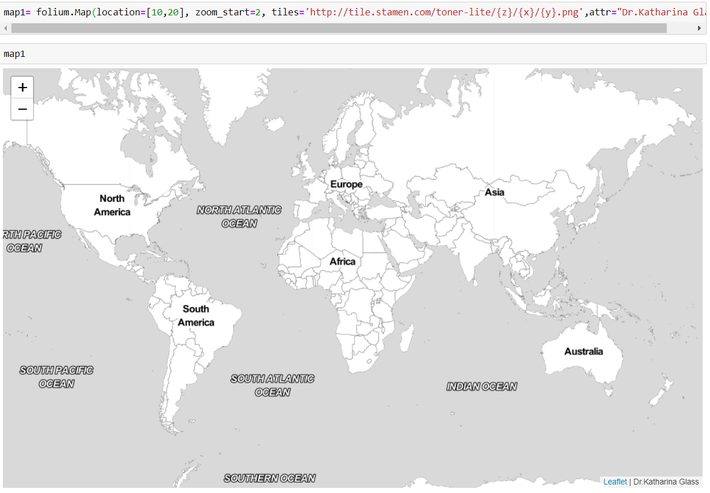
Remember, our map is called now “map1”. To view the map, type: map1.
Step 2. Lets get some data plotted on the map
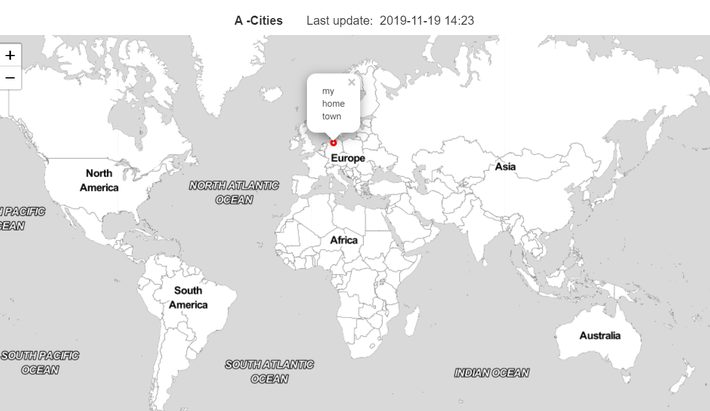
Draw a circle
folium.CircleMarker(radius=3,
location=[53.5278,10.02170000000001],
popup='</b> my home town </b>’,
color=’red’,
fill=False
).add_to(map1)
Now we have one single red circle with the pop-up “my home town”, located in Hamburg, Germany. I will show you how to customize all these parameters further.
Title
To add title to the map need to write some html code. But it’s easy. For a lot of my projects it makes sense to track the last update date for the map. Therefore I will share with you how to do that effectively here as well.
today = dt.datetime.now().strftime(“%Y-%m-%d %H:%M”)
title_html = ”’
<h3 align=”center” style=”font-size:16px”><b>A -Cities </b>
<span <p>Last update: {date} </p></span>
</h3> ”’.format(date=today)
map1.get_root().html.add_child(folium.Element(title_html))
Minimap
You can add a minimap to you map. The offset parameter will help you to get the zoom factor you want. Think twice whether the minimap really makes you visualization better and adds functionality.
minimap = MiniMap(zoom_level_offset=-8)
map1.add_child(map1)
Add locations
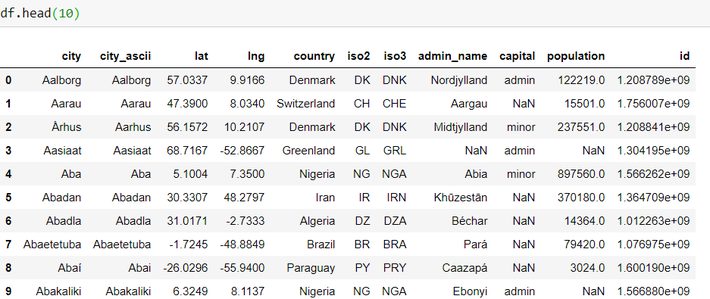
Read the data, if you have not done that yet. For this example, I will take the cities with names beginning with the letter “A” and population from my geo database. So, I have 741 cities with city name, the geo coordinates, population and some other stuff, we ignore.
Put locations to the list:
locations = df[[‘lat’, ‘lng’]]
locationlist = locations.values.tolist()
Then, plot the cities:
for i in range(0, len(locationlist)):
folium.Marker(locationlist[i],
popup=df[‘city’][i],
icon=folium.Icon(color=’darkblue’,icon=’info’,prefix=’fa’)
).add_to(map1)
You can customize both pop-up and icon. I will show you how in the followed up blog post.
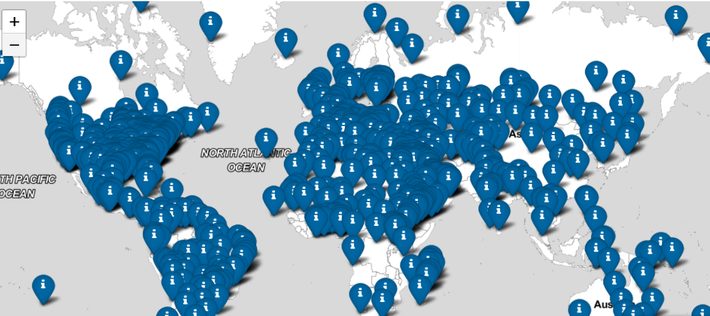
When you have a lot of data points then we map becomes very messy. The solution is to use clusters to make the visualization nicer.
Simple Clusters
Folium has very nice clustering option:
MarkerCluster()
marker_cluster = MarkerCluster().add_to(map1)
for point in range(0, len(locationlist)):
folium.Marker(locationlist[point], popup=df[‘city’][point],
icon=folium.Icon(color=’darkblue’,icon=’info’,prefix=’fa’)
).add_to(marker_cluster)
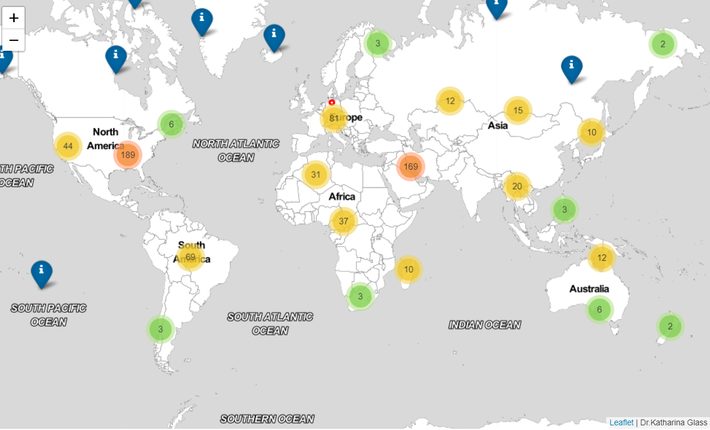
The number within the circle indicates the number of tags in the area. You can customize the folium clustering algorithm. I will show how in the followed up post.
Save
map1.save(‘My A-cities map.html’)
My%20A-cities%20map.html
Note: when you try things out, you must rerun the map from the very beginning. Otherwise the tags are just over the older ones.
Next time I will show you how to customize the stuff and add further fuctions.