
Fighting financial crimes is a daily battle worldwide. Organizations have to deploy intelligent systems to prevent and detect wrongdoings, such as anti-money laundering (AML) control frameworks. We’ll see in this blog post how graph technologies can reinforce those systems.
Using graph technologies to fight financial crimes
In today’s complex economy, law enforcement and financial organizations fight against a wide range of financial crimes: embezzlement, tax evasion, extortion, corruption, terrorism funding or money laundering, to name a few. While tracking down those activities, governments and financial institutions have to deal with a fast moving financial crime landscape and a growing volume of information of various formats.
Graph technologies like Linkurious can be powerful assets to help fight financial crimes. They provide exhaustive overviews of the different entities and their connections. And they support complex data queries on large data-sets in a near-real time environment.
In this article, we’ll focus on anti-money laundering procedures and explore a specific case with a graph approach.
Strengthening AML controls with network analysis
Money laundering is the act of converting proceeds from criminal activities into legal assets, concealing their true origins. Governments have been steadily strengthening AML rules to prevent those activities. Banking institutions are now required to follow strict AML policies and to report money laundering activity suspicions. Ineffective regulation compliance might be penalized with important financial penalties.
Organizations began to develop risk-based AML frameworks to monitor their customers and financial transactions. But criminals deploy sophisticated tactics to hide their wrongdoings. Shell corporations, tax havens or complex financial schemes are used to prevent identification or tracking of money flows. To thwart such criminal strategies, finding information about a specific suspicious entity is not enough. Financial crime units have to investigate the connections between individuals, accounts, companies, locations, to trace complex transactions. This is why network analysis and visualization technologies turned out to be efficient tools to support AML processes.
We will see below how graph technologies like Linkurious can be an additional asset when it comes to monitoring high risk customers for example.
Financial activities visualized as networks
Banking institutions keep track of numerous information sources about their customers (individuals or companies) and their financial activities. Graph database (GDB) technologies like Neo4j, Titan, AllegroGraph or DataStax Enterprise Graph allow to index complex connected data and easily query them to find patterns. With such systems, organizations can compile various information into a single data model.

A possible graph model of financial information
Linkurious provides an advanced graph interface compatible with numerous graph databases to easily explore and monitor the data.
Identifying money laundering patterns with Linkurious
AML regulations require banks to monitor their high risk customers. Listed on special watchlists, those individuals can be identified either by authorities (e.g Politically Exposed Person, Specially Designated National Lists) or by the institution itself (e.g customers with repeated suspicious transactions). “Are my customers currently involved in activities with flagged individuals?” “If yes, are these activities suspicious?”. Organizations need to be able to answer those questions.
Linkurious offers an interface to monitor graph data in real-time. In addition, analysts can set up alerts for specific patterns with Cypher queries. For instance as an AML analyst, I want to be warned each time there is any type of connection between my customer’s financial activities and my watch-list. I can use the following query to create my alert in the system:
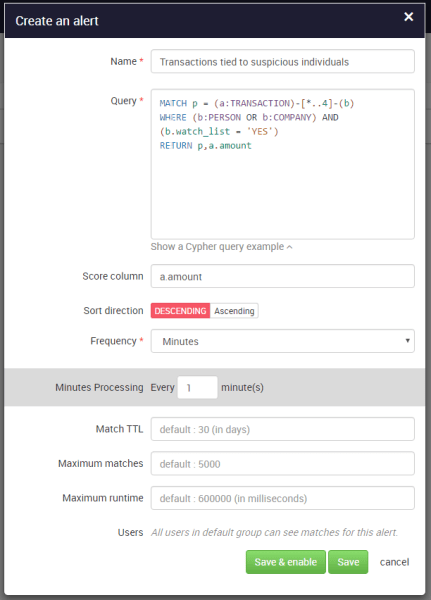
Creation of an alert query
If new data are collected, such as transactions, persons, companies or relationships, Linkurious will automatically update and look for suspicious connections. With the advanced graph visualization interface, it’s then easy to investigate and assess the different cases.
Visual investigation of financial activities
The alert system reported several matches to our query. To evaluate the risk-level of the cases, analysts can use the interface to quickly visualize and investigate. Let’s check one of them:

Visualization of one of the matches signaled by the alert query
In a glimpse, I see that Angela Marshall (a fictitious individual who figures on my watch-list) is indirectly connected to a transaction on a customer’s bank account. She appears to share the same address as my customer, the company Miboo.
This pattern is relatively suspicious. I might want to explore beyond this single connection and see which other entities are linked to this address.

Investigating the entities linked to the address
In addition to sharing an address with an individual on a watch-list, our suspicious customer also share his address with three other companies and two of our internal employees. They are all living in the city of Hongqiao, China on 3557 Straubel Circle.

The address, 3557 Straubel Circle is located in Hongqiao, in China
As an analyst, I might recognize a known pattern of money laundering: different companies registered with a unique address. Also, some employees are connected to a known high-risk customer. Those information can be reported to higher authorities to further investigation on the field.
Graph analysis focuses on relationships, therefore helps to discover hidden connections between different entities. Linkurious also operates an alert system in a near-real time environment. That way, financial crime units can identify suspicious activity schemes instantly and reinforce their AML regulation system.
For more, click here.