
This article was written by Reiichiro Nakano.
There are a number of visualizations that frequently pop up in machine learning. Scikit-plot is a humble attempt to provide aesthetically-challenged programmers (such as myself) the opportunity to generate quick and beautiful graphs and plots with as little boilerplate as possible.
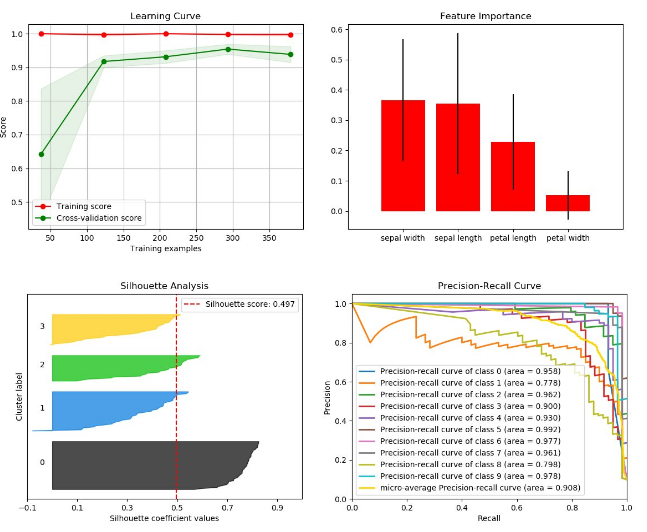
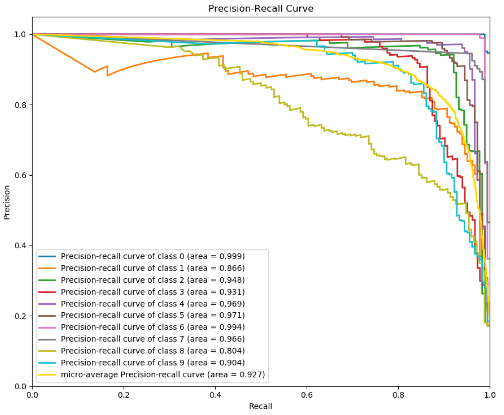
Here’s a quick example to generate the precision-recall curves of a Keras classifier on a sample dataset:
# Import what’s needed for the Functions API
import matplotlib.pyplot as plt
import scikitplot.plotters as skplt
# This is a Keras classifier. We’ll generate probabilities on the test set.
keras_clf.fit(X_train, y_train, batch_size=64, nb_epoch=10, verbose=2)
probas = keras_clf.predict_proba(X_test, batch_size=64)
# Now plot.
skplt.plot_precision_recall_curve(y_test, probas)
plt.show()
Installation is of the sciplot library is simple! First, make sure you have the dependencies Scikit-Learn and Matplotlib installed.
Then just run:
pip install scikit-plot
Or if you want, clone this repo and run
python setup.py install
at the root folder.
Originally posted here.