
Stakeholder Journey Maps are a fabulous tool to intimately understand what a stakeholder is trying to accomplish (their objectives and intentions) and the steps/actions/decisions that stakeholder needs to make to complete their journey.
Stakeholder Journey Maps are commonly used to help designers to create the optimal user interface and nicely segue into UI storyboards and wireframes. But oh, design is so much more than just a pretty UI.
What I find even more exciting – and profitable – about a stakeholder journey map is how one can use it to understand where and how to leverage big data plus advanced analytics (artificial intelligence, machine learning, deep learning) to create Data Products that re-invent those stakeholder journeys and transform the stakeholder experience.
So, let’s dive in. I think this is going to be fun!
What is a Stakeholder Journey Map?
Stakeholder Journey Map provides a visual picture to help designers and developers identify and triage a stakeholder’s actions or decisions to complete a specific journey such as buying a house, repairing machinery, applying to college, or creating the ultimate burrito (Figure 1).
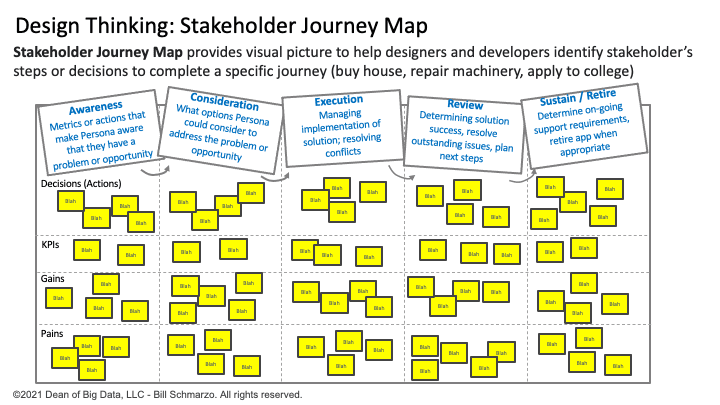
Figure 1: The Stakeholder Journey Map Design Template
The journey map looks at the stakeholder journey across five (5) stages of the journey:
- Awareness. Identifying and understanding the conditions has made the targeted stakeholder aware that they have a problem or opportunity that needs to be addressed.
- Consideration. The targeted stakeholder considers the options to address or solve the problem or opportunity.
- Execution. The process of managing the implementation of the solution and resolving any conflicts and/or changes that arise during the implementation of the solution.
- Review. Ascertaining solution implementation success, identifying and resolving outstanding issues, and planning next steps and solution enhancements.
- Sustain / Retire. Determining ongoing support requirements to sustain the solution or retiring the journey when appropriate.
The goal of the stakeholder journey map is to capture the actions or decisions that the targeted stakeholder needs to navigate the 5 stages of the journey. And a critical component to the journey map exercise is identifying the KPIs or metrics that the stakeholder will use to measure the progress and success of each of those actions or decisions.
Stakeholder Journey Maps to “Optimize” Business Processes
Let’s say that you are trying to optimize your stakeholder’s dining experience. That experience starts well before they enter your dining establishment and extends beyond when they leave your dining establishment. We begin the journey map exercise by identifying or observing the actions or decisions that your targeted stakeholder needs to make along the 5 stages of their dining journey (Figure 2).
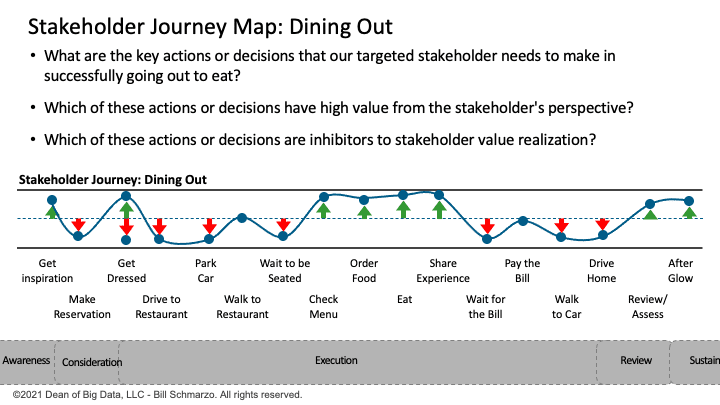
Figure 2: Dining Out Stakeholder Journey Map
A key part of the journey mapping exercise is to identify which actions or decisions are Gains (have associated value to their stakeholder) and which actions or decisions are Pains (inhibit the stakeholder realization of value).
Note: this journey map exercise works if you are trying to determine how to reduce unplanned operational downtime on a piece of machinery, reduce unplanned hospital readmissions, improve college students’ 5-year graduation rate, or most any business or operational challenge before you.
Ideating and brainstorming (Design Thinking strengths) across the stakeholder journey map might identify opportunities to create Data Products that optimize actions or decisions along the stakeholder journey. What is particularly interesting is the opportunity to create Data Products to alleviate and monetize the pain areas, such as Open Table to optimize the reservation process and Uber / Lyft to optimize the restaurant transportation pains (Figure 3).
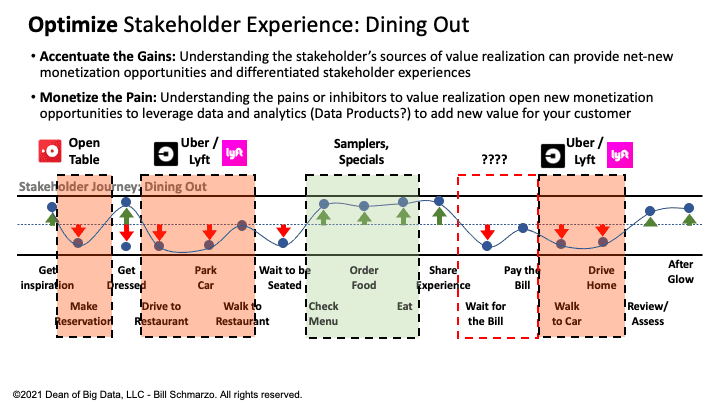
Figure 3: Optimize the Stakeholder Dining Out Experience
Stakeholder Journey Maps to “Re-invent” Business Processes
While there is good money to be made in optimizing those existing business processes, organizations need to consider if those existing business processes are even relevant in today’s world. Are we just optimizing the cow path?
By coupling the journey mapping exercise with design thinking (to liberate ideation and rapid exploration) and data science (to leverage AI / ML to uncover the customer, product, service, and operational predicted insights to automate or eliminate steps in the stakeholder journey) to reinvent the stakeholder journey (Figure 4).
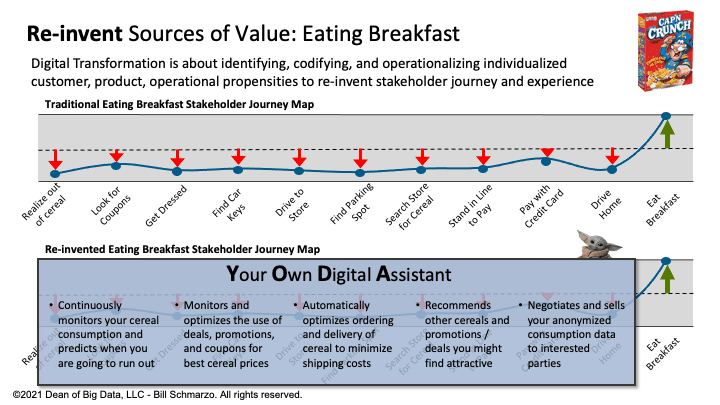
Figure 4: Re-invent Stakeholder Eating Breakfast Journey
In Figure 4, we’ve reinvented the eating breakfast stakeholder journey by leveraging data science (AI / ML) plus design thinking to create a Data Product that re-invents the stakeholder experience by eliminating many of the low-value decisions or actions found in the traditional stakeholder journey… as well as providing new revenue opportunities.
Role of Data Products to Re-invent Stakeholder Journeys
Data Products represent the packaging of Data Management, Data Science, Application Development, and Customer Experience with AI / ML to create Data Products that can continuously learn and adapt to deliver high-value business or operational outcomes.
That ability to share, reuse, and continuously refine the underlying data and analytic components across a common data and analytics architecture accelerates the development of Data Products and enables the orchestration of Data Products to address more complex business value chain use cases.
For example, we can orchestrate a series of data products to solve a bigger problem by improving the organization’s customer marketing pipeline effectiveness (Figure 5).
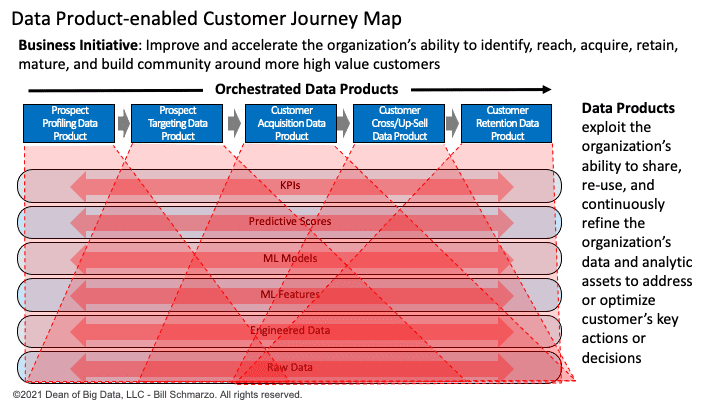
Figure 5: “Building a Data Products-centric Business Model”
This Data Products architecture in Figure 5 is enabled by advances in analytics capabilities to leverage AI / ML to create semi-autonomous, continuously learning and adapting products, policies, and procedures (Figure 6).
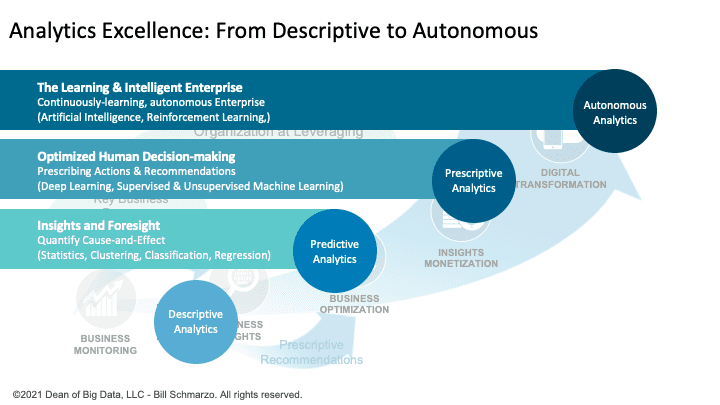
Figure 6: “Analytics Excellence: from Descriptive to Autonomous Analytics”
Summary
The Stakeholder Journey Map is a powerful, collaborative engagement tool, but it can go well beyond just developing a pretty User Interface.
What I find far more interesting about a stakeholder journey map is how it can be used to understand where and how to leverage big data plus AI / ML to create Data Products that can optimize and re-invent the targeted stakeholder’s journeys and transform the stakeholder experience.
Why optimize the cow path when one can re-invent it!