

Oh boy. We are getting into that season when we get inundated with political blathering, grandstanding, selective memories, and revisionist history. Lots of overly generalized messages designed to get out the base – those voters who always support a party’s candidates no matter whatever crazy-ass things their candidate says or does. That’s how elections have been run for generations as they appeal to the most basic “us versus them” instincts. And that strategy works well… for the base.
But something different is required to win elections today, and that’s the ability to appeal to the rapidly growing independent or “swing” voters. According to “The Rise of Independents”, the number of independent voters – votes who do not identify with one of the major political parties – is on the rise:
“Before World War II, over 80% of voters affiliated with one of the major parties. Today, a plurality of American voters—in some polls, more than 45%—identifies as an independent.”
That’s right. Before World War II, less than 20% of voters classified themselves as independents. Today that number is greater than 45%.
As politics fails to appeal to more Americans, politicians will need to embrace a different approach to appeal to those important independent “swing” voters who will decide our political leaders. So how does the modern political campaign win in this changing world?
Principal #1: All Political Choices are Individualized Choices
No one is average.
As I discussed in my blog “The Danger of Making Decisions based upon Averages”, the Jaggedness Principle asserts that by measuring a collection of traits across a sufficiently large number of individuals, roughly half of individuals will be above average, and roughly half will be below average for any particular trait. And that across all the traits, few (if anyone) will be “average.”
Everyone is unique. To influence those important swing voters, you’ll need to appeal to them individually. That’s where Nanoeconomics comes into play. Nanoeconomics is the economics of individual human predicted behavioral and performance propensities. Campaigns must embrace nanoeconomics to create individualized messages if they seek to successfully influence those swing voters.
Principal #2: Broadly Define the KPIs and Metrics that Measure Success
It’s very easy to think that there is only one political metric that matters – gathering more votes than your opponent. Very black and white. You got winners, and you got losers. End of game. Let’s fire up “House of the Dragon.”
But politics is about more than just the current election. It’s about cultivating a “following” who shares similar (but not always the same) beliefs and principles. Consequently, one needs to think more broadly in identifying, validating, and prioritizing the KPIs and metrics against which to measure political and campaign success (Figure 1).
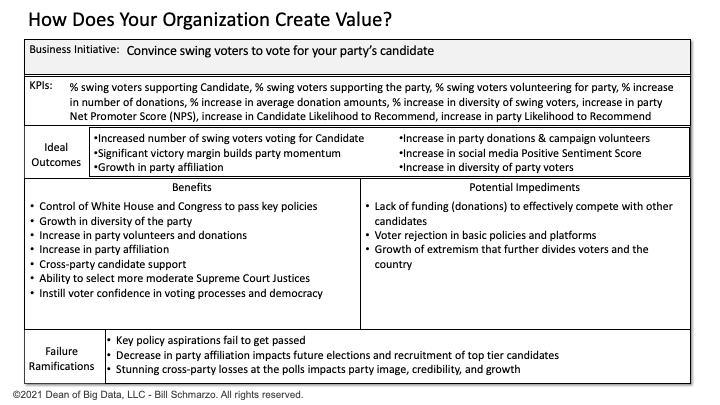
Figure 1: Completed Political Campaign Value Creation Design Template
The example Political Campaign design canvas in Figure 1 ensures that there is consensus and alignment across key constitents on how the party defines its value creation efforts and identifies the KPIs and metrics against which the party will measure its value creation and political party objectives effectiveness.
Principal #3: Empower Front-line Canvassers to Identify Best Predictors
There exists lots of publicly available and third-party data on each individual voter. See the blog “Here are the data brokers quietly buying and selling your personal information” for examples of personal data that anyone can purchase from third-party data brokers. It will both surprise and terrify you (Figure 2).
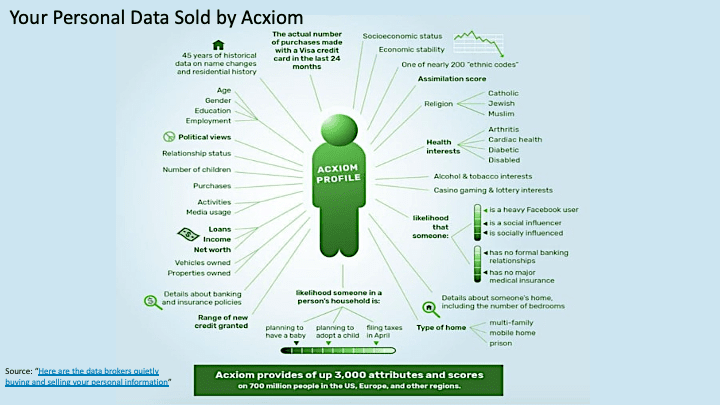
Figure 2: Your Personal Data for Sale
This third-party data provides a good start on creating individualized messaging and actions… but it is only a start. Your organization needs to expand the capture of voter and policy-specific data to improve the predictive accuracy of your voter propensity models. This is where the empowerment of your front-line workers (canvassers) will be invaluable.
Smart organizations (not just political parties) seek to empower their front-line workers – those employees at the front lines of customer and operational engagement – to engage their natural human intuition to identify those small, nuanced insights that might be better predictors of behaviors. The key ideation liberating, a design-driven mindset underpins the “Thinking Like a Data Scientist” methodology (Figure 3).
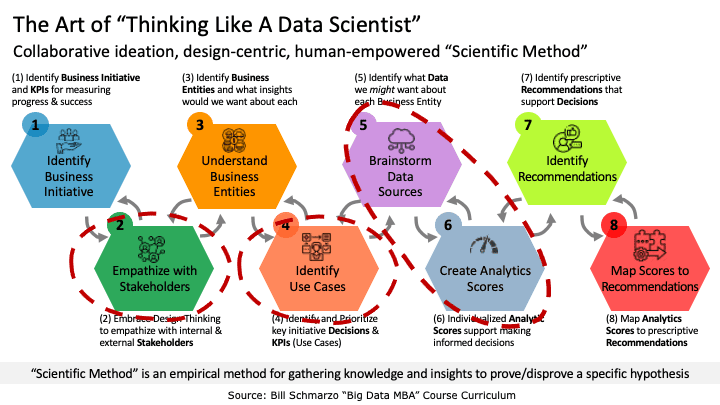
Figure 3: The Art of Thinking Like a Data Scientist
Your front-line employees play a key role in the data science, and value creation process by:
- Identifying and validating the KPIs and metrics against which value creation effectiveness will be measured.
- Brainstorming the Features around which the ML models will seek to optimize in creating key analytic propensity scores.
- Identifying and quantifying the associated costs of the ML models False Positives and False Negatives (the step that many organizations tend to skip).
Principal #4: Create Individualized Analytic Scores
An analytic Score is a normalized, mathematically-generated number that predicts a certain outcome or action’s likelihood (or propensity). Analytic Scores are used in performance tracking and decision making
An analytic score can be created for every major business or operational decision to improve the accuracy, relevance, and effectiveness of decision-making. The most common example of an Analytic Score is a Credit Score that predicts an individual’s likelihood, or propensity, to repay a loan (we all have unique Credit Scores).
In our political example, we want to create a “Likelihood to Vote for Candidate” analytic score that measures the likelihood or probability that someone would vote for that candidate.
Principal #5: Build Individualized Analytic Profiles
Ultimately, we want to capture, share, and continuously refine these analytic scores so that they can be used to drive messaging and actions across multiple political uses. We will store these analytic scores within an Analytic Profile to facilitate this.
Analytic Profiles are a key-value data model for capturing, codifying, sharing, and refining the individualized analytic scores (predicted behavioral and performance propensities). The Analytic Profiles enable the application of the analytic scores to drive precision actions and decisions in political use uses, including voter targeting, campaign messaging, voter donations, voter volunteering, and other political outreach programs and activities (Figure 4).
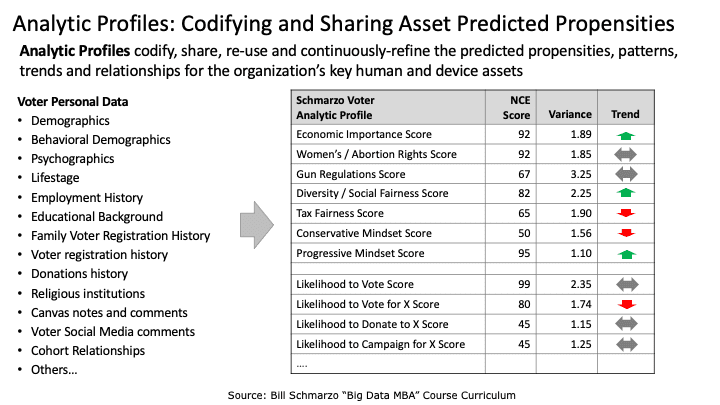
Figure 4: Bill Schmarzo Voter Analytic Profile…this is only an example…
Principal #6: Leverage Analytic Scores to Focus Resources on High-Probability Swing Voters
This is truly where the rubber meets the road. This is where you would apply the “Likelihood to Vote” (LTV) and “Likelihood to Vote for Your Candidate” (LTVC) scores to target your campaign efforts, messaging, and outreach programs on those swing voters who could be convinced to vote for your candidate and show up to vote (Figure 5).
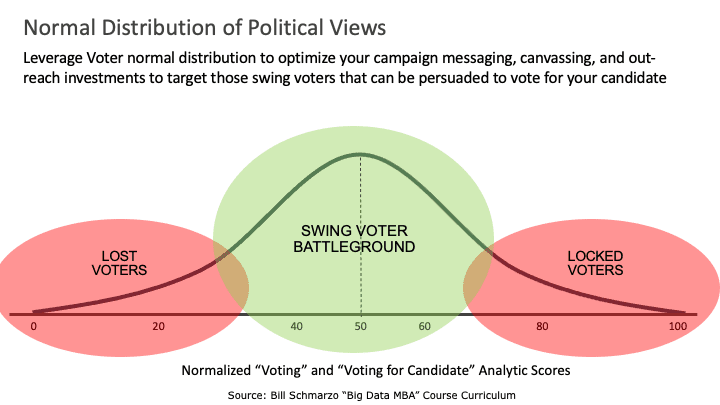
Figure 5: Focusing Resources on Highest Impact Voters
Three observations about the voters are represented in Figure 5:
- Locked Voters, voters with greater than an 80% “Likelihood to Vote” AND “Likelihood to Vote for Your Candidate” scores are probably worth only a small investment. They can only vote once (legally), and unless you are trying to increase their donations and volunteering (which requires a different set of analytic scores), you’d best focus resources elsewhere.
- Lost Voters, voters with less than a 30% “Likelihood to Vote for Your Candidate” score are probably worth zero investment. You are not going to change their minds (remember, they are the other party’s base, and the base can be extremely tolerant of their own candidate’s shenanigans). Remember, many Americans can’t be convinced that the earth is not flat…
- Most of your time and effort should be focused on those swing voters. Having analytic scores on each major policy issue (e.g., women’s rights, gun rights, immigration, jobs, education, climate change) is critical for further refining your messaging and out-reach efforts on those swing voters who have the “right” beliefs and attitudes to swing over to your candidate.
Final note: never rely upon a single score to make your decision. In our political example, a high “Likelihood to vote for Candidate” score doesn’t mean much if the same person has a low “Likelihood to Vote” score.
Summary
As more Americans become political Independents, old campaign strategies of firing up your base will prove insufficient. “Playing to the base” might be enough to get you nominated by your party but unlikely enough to get you elected in a general election.
Consequently, it is time for political campaigns to embrace data science best practices (nanoeconomics, analytic scores, analytic profiles, thinking like a data scientist methodology) that leading commercial organizations are using today to drive more meaningful business and operational outcomes.
That means treating every voter as an individual (not an overly generalized group) and investing the time and effort to learn more about their individual concerns and aspirations. Now, isn’t that what politics is supposed to be about?