
- Recent news reports highlight a shrinking job market for data scientists
- Faulty data analysis seems to be behind the headlines
- Tips to avoid common mistakes in your data presentations
Some alarming headlines emerged this week regarding the state of data science jobs. If you’ve browsed the data science news recently, you might have seen claims about the “shrinking ” and “cooling down” data science job market. No need for alarm though: All is not as it seems. These latest news stories offer some great examples of one of my favorite subjects: misleading graphs and statistics.
“The Data Science Job Market is Shrinking!”
This graph, nestled within an Interviewquery.com article titled Data Science Job Market Shrinking as Data Engineering Grows Exponentially, shows a sharp drop for data scientists (in dark blue).
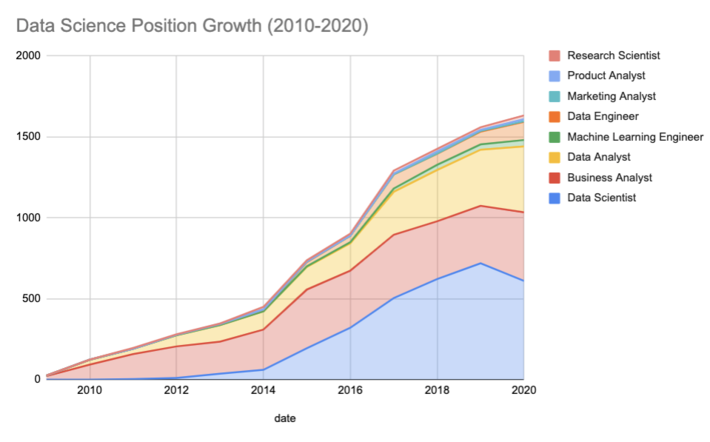
The major issue with the graph is that it shows a dip in job growth, not in actual jobs. By making the visual focus of the chart a list of job titles, the viewer can be led to the incorrect assumption that data science jobs are plummeting, rather than experiencing a minor slow down in job growth.
Also problematic: The missing label on the y-axis, which is a classic no-no when creating graphs. I’m going to assume that the axis might indicate the number of jobs, or interviews. But it shouldn’t be up to me, the viewer, to make that assumption. Another unfortunate problem with this graph is a lack of uncertainty information–how well do the statistics represent the data? Considering this graph was compiled from one study that doesn’t seem to involve random selection at all, it’s possible that the confidence intervals for that 15% could be large enough to make the graph practically useless.
The graph wasn’t the only issue from the article, which was based on an analysis of “over 10,000 data science interview experiences.” Where did these interview experiences come from? A survey? Scouring the web? The answers weren’t clear, which left me with more questions than answers. To make things worse, Interviewquery.com’s claim was widely replayed over the internet, including one version posted on Yahoo News [3] that reported
“Data science used to be the sexiest job of the 21st century. Now, the pandemic has cooled it down dramatically.”
Even if the claim was true, it’s misleading to call a 15% decrease (in what is otherwise healthy job growth) “dramatic”.
The reality is, data science jobs are still headed upwards, albeit at a slightly reduced rate. In contrast to the alarmist headline, LinkedIn recently listed data science as one of 2021’s “Jobs on the Rise” [2].
Takeaway: The human brain is easily tricked into seeing patterns in data that aren’t really there. Make sure to follow best practices (like labeling axes) when creating graphs, and always report the methodology you used.
Data Science & Analytics Hiring Survey Results are…Uncertain
On the search for more information on the current state of hiring in data science, I came across another article, this time by Burtch Works Executive Recruiting [4]. The article reported that Burtch’s annual flash survey was sent out to their network, which represents “…over 150 companies across the US”. The survey found that
“73% of data science and analytics teams are planning to hire during Q1 or Q2 of 2021. This is actually a significant increase from last year, where 67% of teams planned to hire in the first half of 2020. ”
The authors note that their survey “represented” 150 companies across the US. The word representative has some pretty strong connotations in data analysis. A representative sample is
“…where your sample matches some characteristic of your population, usually the characteristic you’re targeting with your research “[5]
For example, if you’re conducting a survey about hiring data scientists, you would want your sample to reflect a broad sample of different companies–not just ones that are convenient for you to ask. Forbes lists Burtch Works at #141 on a list of “America’s Best Recruiting Firms in 2020” [6]. So while their survey may be representative of their clientele, it most likely isn’t representative of a countrywide trend. To be fair, the article’s authors don’t claim that their survey reflects the entire state of the data science hiring industry, but with a headline like 2021 Data Science & Analytics Hiring Survey Results Q1 and Q2 one is led to believe that their survey represents more than just a small sliver of businesses.
Takeaway: Use caution when including strong statistical language like “representative” in your findings, and make sure your headlines (or report titles) accurately reflect the content.
References
[1] The 2021 Data Science Interview Report
[2] LinkedIn Jobs on the Rise: 15 opportunities that are in demand and …
[3] Data Science Job Market Shrinking as Data Engineering Grows Exponen…
[4] 2021 Data Science & Analytics Hiring Survey Results Q1 and Q2