
Over a period, large organizations have been transformed into disintegrated silos that has grown to be a major impediment to respond to changing market demands with agility. Organizational silos have led to innumerous disconnected policies, systems, processes, standards, teams. In order to sustain in this digital era, it’s imperative for organizations to take a top down enterprise value chain view to continually evaluate its ability to adapt (as well as compete) to changing market demands->change business models and/or objectives->create or optimize processes->design or enhance systems->manage and govern data. Often it is observed, impact of bottom link (data) in this value chain is not well understood and therefore less adequate time spent.
DG Approach: A bottom up perspective gives an opportunity for data practitioners to present data’s value in meeting business objectives and become a key influencer in system designs, process enhancement (inclusive of business, data related processes), policy changes. This approach enables visualization of data issues through key business metrics that are derived from critical data elements (CDE). Data stewards who owns these CDEs will be able to break organizational silos with these data ammunition, garner support from impacted stakeholders to initiate cross-functional data governance initiatives.
DG Goal: To enable organizations to meet its various business objectives by ensuring good data quality (increase revenue, reduce cost), being compliant (tax, statutory, legal, regulatory, industry standards, internal control requirements), protect data (data privacy – GDPR, CCPA, HIPPA, PCI DSS etc.).
DG Framework: A generic framework like DMAIC (Define, Measure, Analyze, Improve, Control) is an effective data driven framework to execute data governance. You may see different forms of this framework being implemented in organizations.
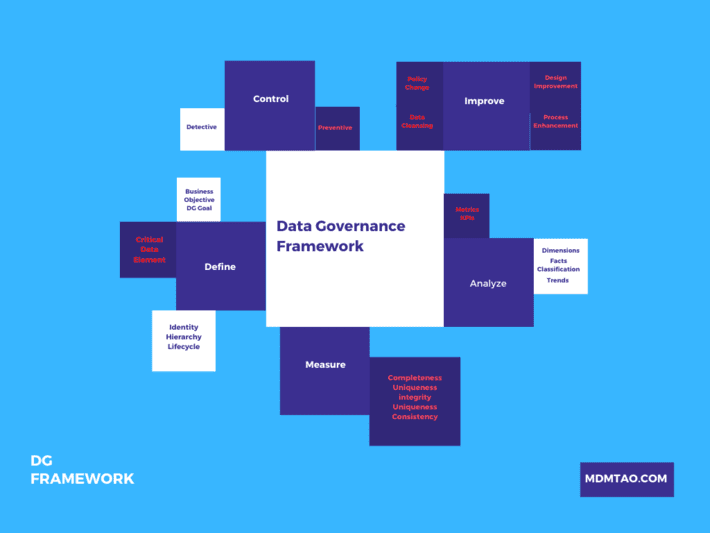
DEFINE: Define CDEs across data domains that impacts business objectives and categorize them by identity, hierarchy, lifecycle. CDEs belonging to master data, reference data and organizational data objects are critical to be governed.
MEASURE: Define business rules (DQ METRIC) based on 6 DQ dimensions (completeness, uniqueness, conformity, accuracy, integrity, consistency) of CDEs and measure data quality against these rules. AI/Machine learning techniques can be leveraged to detect unknown business rules, hidden data relationships and newer clusters from underlying data sets.
ANALYZE: Map DQ METRIC to BUSINESS METRIC to BUSINESS KPI. Visualize data issues through BUSINESS METRIC, KPI that are derived from CDEs. Facts visualized through classifications and trends helps to develop focus areas and drive actionable insights. A dimensional exploration of facts must be developed for key decision makers to slice and dice facts.
IMPROVE: Business KPI driven insights will enable stakeholders to prioritize actions that results in data cleansing efforts, process enhancements (data conversion, master data management (MDM), data governance), system design improvements, special projects (e.g. digital transformation) and policy changes.
CONTROL: Establish preventive and detective controls in process (e.g. passive validation), system (e.g. active validation), data (e.g. protect restricted data), people (e.g. RACI, decision rights). A continuous data quality monitoring process against agreed business KPIs enables organizations to respond to market needs effectively.