
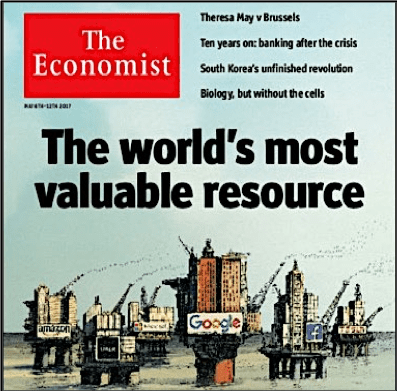
The Big Data craze caught fire with a provocative declaration that “Data is the New Oil”; that data will fuel the economic growth in the 21stcentury in much the same way that oil fueled the economic growth of the 20thcentury. The “New Oil” analogy was a great way to contextualize the economic value of data; to give the Big Data conversation an easily recognizable face. The Economist recently declared data “The World’s Most Valuable Resource” with an issue cover that featured leading organizations drilling for data.
However, understanding the “economics of oil” starts by understanding the differences between raw oil and refined fuel. To create value out of oil, oil must first be refined. For example, when raw oil (West Texas Crude) is refined into high-octane fuel (VP MRX02 high-octane racing fuel), the high-octane fuel is 16.9x more valuable than the raw oil[1](see Figure 1).
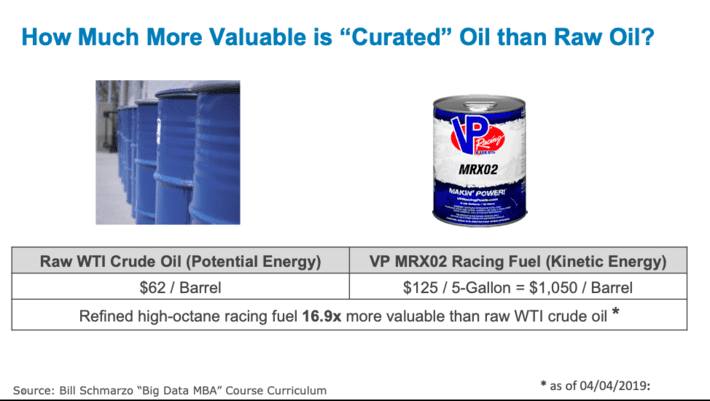
Figure 1: Refining raw oil into more valuable racing fuel
Raw crude oil goes through a refinement, blending and engineering process where the crude oil is transformed into more valuable products such as petroleum naphtha, gasoline, diesel fuel, asphalt base, heating oil, kerosene, liquefied petroleum gas, jet fuel and fuel oils. This is a critical process that needs to be performed before the downstream constituents (like you and me and industrial concerns) can actually get value out of the oil (as gasoline or heating oil or diesel fuel). Oil in of itself, is of little consumer or industrial value. It’s only through the refinement process that we get an asset of value (see Figure 2).
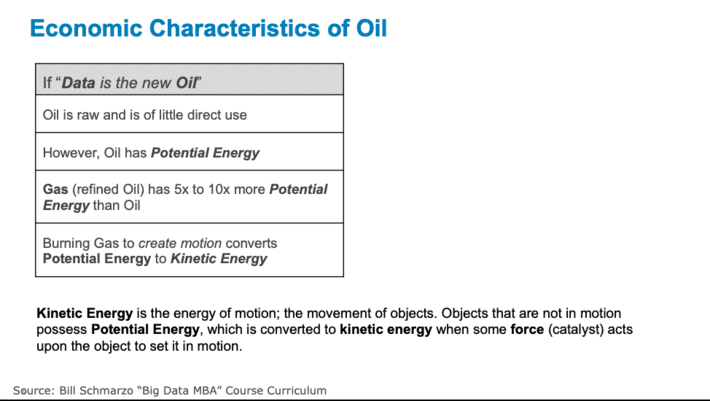
Figure 2: Economic Characteristics of Oil
Without this oil refinement process, we’d all have to pour barrels of raw oil into our cars and then let the cars do the refining process for us. Not exactly a user-friendly experience. Plus, that requirement would have dramatically reduced the value of oil to the world.
And this is exactly what we do in Information Technology; we give our users access to the raw data and force each use case or application to have to go through the data refinement process to get something of value (see Figure 3).
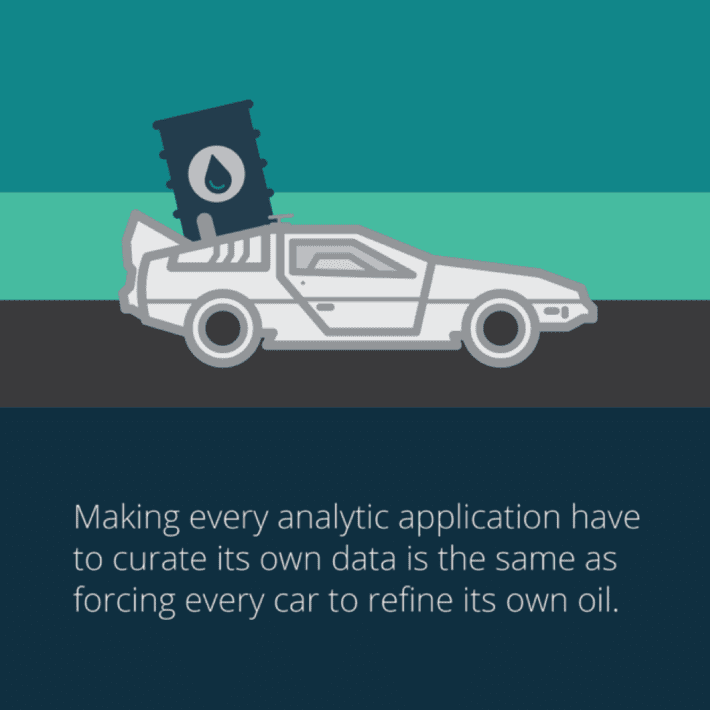
Figure 3: Forcing Cars to Refine their Own Oil
Forcing every analytic use case or application to curate its own data is not only not very user-friendly, but it dramatically reduces the value of the data to the organization. If we really want to serve the organization’s “consumers of data”, we need a methodical process for refining, blending and engineering the raw data into something of higher value – “curated” data.
The Economics of Curated Data
Data experiences the same economic transformation as oil. Raw data needs to go through a refinement process (cleanse, standardize, normalize, align, transform, engineer, enrich) in order to create “curated” data that dramatically increases the economic value and applicability of the data (see Figure 4).
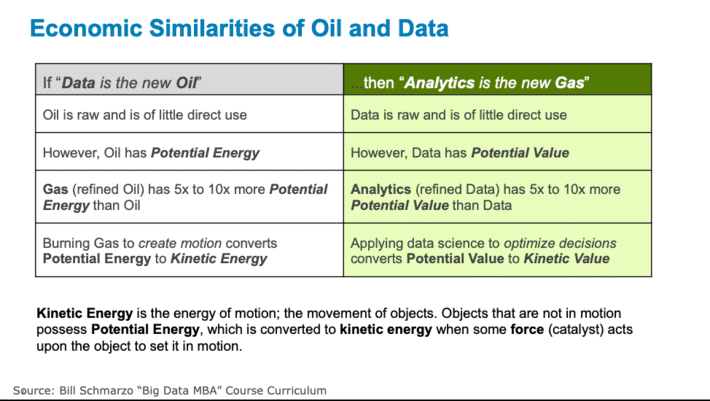
Figure 4: Economic Similarities of Oil and Data
So, what is curated data?
Wikipedia defines it this way:
“Data curation is the organization and integration of data collected from various sources. It involves annotation, publication and presentation of the data such that the value of the data is maintained over time, and the data remains available for reuse and preservation. Data curation includes ‘all the processes needed for principled and controlled data creation, maintenance, and management, together with the capacity to add value to data.’”
This is a good start and I will expand upon that Curated Data definition with the following additional characteristics:
- Time and effort have been invested in the data with the goal of improving data cleanliness, completeness, alignment, accuracy, granularity (the level at which the data is stored), and latency (when the data is available for analysis)
- The data sets have been enriched with metadata including descriptive metadata, structural metadata, administrative metadata, reference metadata and statistical metadata.
- The data is highly governed to ensure the availability, usability, integrity, security and usage compliance of the data across the organization’s different use cases.
- Finally, the data has been cataloged and indexed so the data can be easily searched, found, accessed, understood and re-used.
Table 1 shows the types of refinement processes that structured and unstructured data would need in order to convert that raw data into the higher-value, more usable curated data.
|
Structured Data Curation |
Unstructured Data Curation |
|
• Identifying • Verifying • Cleaning • Transforming • Integrating • Deduplicating |
• Data Extraction • Data Indexing and Re-indexing • Data Annotation • Ontology Building • Data Harmonization |
Table 1: Types of Data Curation
A white paper titled “Scalable Data Curation and Data Mastering” written by industry guru Michael Stonebraker, Chief Technology Officer of Tamr, states that data curation is a combination of processes used to combine data from disparate sources into a composite whole. These processes include:
- Extraction of data from source data systems into a common place for processing (data lake)
- Transformation, normalization and standardization of data elements. For example, converting from Euros to US Dollars. This is to ensure that we are comparing apples to apples in our analysis.
- Data cleaning.For example, in some data sets -99 actually means null (N/A) which if you have wrong, wreaks havoc on your statistical calculations.
- Schema integration and associated data labeling. For example, your “wages” is someone else’s “salary”.
- Entity consolidation (i.e. producing clusters of records thought to represent the same entity). For example, I might be identified as Prof. Schmarzo in one data set and Bill Schmarzo in a second one (or in the data set where my mom is mad at me, I’d be William Dean Schmarzo).
- Cluster reduction. For each cluster, a single record must be constructed to represent the records in this cluster. This process is usually thought of as producing a “golden record” for each cluster.
- Export (Load). The composite whole is usually exported to a data repository
Economic Value of Data
Data curation and data governance is like going to the dentist; everyone knows that it is good for you, but no one actually wants to do it. In the data warehouse era, probably one of the most difficult (and most often rejected requests) was getting the end users to own the governance of their own data sets. Why? Because these end users never saw or understood the value of the data. But those days are a changin’.
My blog “Determining the Economic Value of Data” introduced several new concepts to help organizations to quantify the economic value of their data. That blog highlighted some key concepts about the economic value of data including:
- The frame for determining the value of data is not a “value in exchange” or accounting frame, but instead is a “value in use” or economics frame. That is, the value of the data is not by what someone is willing to pay you for that data, but instead the value of the data is determined by the value that one can create using that data to optimize key operational and business processes, and uncover net-new monetization opportunities.
- One must start the data valuation process by understanding the business and operational value of the organization’s key business initiatives. That is, what is the business trying to accomplish over the next 12 months and what is the business and operational value of achieving that goal? This establishes the value against which we will focus our Economic Vale of Data attribution process.
- Then one needs to go through a process (we call it “Thinking Like A Data Scientist”) to identify, validate, vet, value and prioritize the use cases that support the organization’s key business initiatives. This process requires the close collaboration with the key stakeholders and constituents to complete this identification-to-prioritization process (see Figure 5).
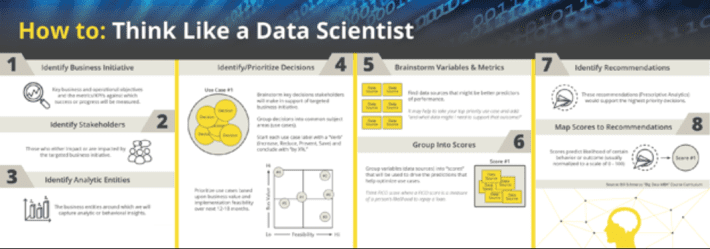
Figure 5: “Thinking Like a Data Scientist” methodology
- Finally, one must apply Data Science to quantify the attribution of the use case’s business and operational value to each of the contributing data sources (see Figure 6).
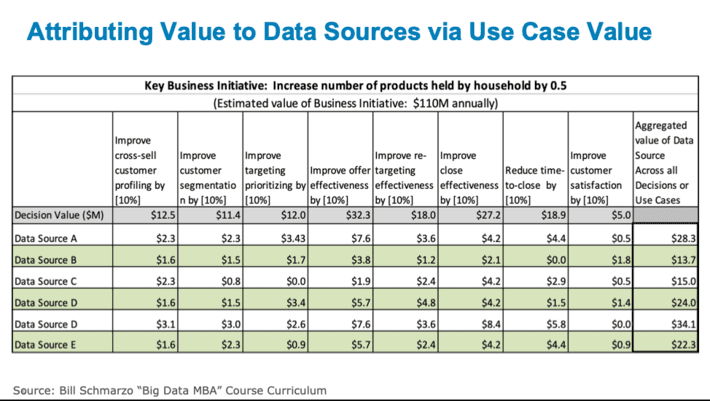
Figure 6: Attributing Value to Data Sources vis-à-vis Use Cases
See the elaborate University of San Francisco research paper titled “Applying Economic Concepts to Determine the Financial Value of Your Data” that details the concepts, methodology and process that any organization can use to determine the economic value of their data.
And for those folks who need a refresher on some economic basics, check out my blog “Data and Economics 101” because you’ll probably have a hard time digging up your college econ book buried in your parent’s garage…hint, Alec (see Figure 7).
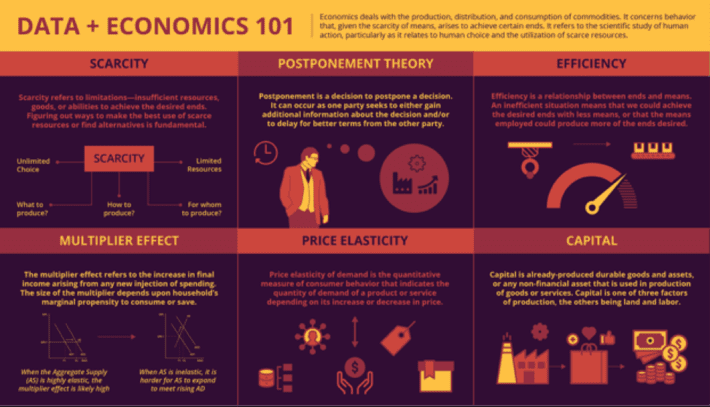
Figure 7: Data + Economics 101
Weaving Raw Data into Gold
The story of Rumpelstiltskin was about a weird little man with the ability to weave raw hay into gold. Well, there may be a bit of truth in that old story, as leading organizations today are learning to weave raw data into business gold.
We understand that when raw oil is refined into high-octane fuel, the refined high-octane fuel is 16.9x more valuable than the raw oil. But how much more valuable would that barrel of high-octane be if that fuel never depleted, never wore out and could be used over and over again across an unlimited number of use cases?
Obviously, the value of that barrel of high-octane fuel would be worth more than the 16.9x the value of the raw oil. In fact, that barrel of high-octane fuel that never depletes, never wears out and can be used over and over again across an unlimited number of use cases would likely have infinitevalue.
Maybe the right analogy isn’t the Brothers Grimm story of “Rumpelstiltskin” but is the Brothers Grimm story of the “Golden Goose” who laid the golden egg!
That is what makes data a unique asset; an asset like we have never seen before. And you don’t need a weird little man (other than a data scientist) to weave raw data into business gold.
Summary and Blog Highlights:
- The “Data is the new Oil” metaphor is useful in trying to understand the “economics of oil” and the economic differences between raw oil and refined fuel.
- The “Economics of Data” is an even more powerful conversation when trying to contemplate the business and operational value of “curated” data versus “raw” data
- Making every analytic application curate its own data is the same as forcing every car to refine its own oil
- “Curated” data is raw data that has been gathered, cleansed, aligned, normalized, enriched with metadata and is cataloged, indexed and governed to ensure its proper usage.
- Leading organizations today are trying to weave raw data into business gold by understanding and exploiting the economic value of data.
[1]My math. Prices on 04/04/2019:
- Price West Texas crude = $62/barrel
- Price VP MRX02 Racing Fuel $125/5 gallons or $25/gallon
- 1 barrel = 42 gallons
- 1 barrel of VP MRX02 = $1,050/barrel