
- Statistical analysis is poorly misunderstood by many, resulting in array of problems.
- There are many ways to ruin your data analysis.
- 4 of the less well-known mistakes to watch out for.
I recently came across an article in eLife (a peer reviewed journal) called Ten common statistical mistakes to watch out for when writing or reviewing a manuscript [1]. Although the paper was geared towards reviewers of research papers, many of the items apply to data analysis in general. According to the authors, mistakes happen because of a poor choice of experimental design, incorrect analysis tools, or flawed reasoning. Fairly well-known problem areas mentioned in the paper include spurious correlation [no term], misleading graphs [no term], or not correcting for multiple comparisons [no term]. However, there are many more less obvious ways to taint your results. The following four categories are surprisingly common analysis pitfalls–even in peer-reviewed, published research.
1. Comparing Groups Indirectly
Comparing two groups isn’t as easy as running a t-test [no term] and drawing a conclusion about effect sizes [no term]. For example, you might find a significant [no term] effect in one group and not another. Based on that, you might draw a conclusion about the effect in the “significant” group being larger than the non-significant group. But this is a faulty conclusion: it’s possible for two groups to have near-identical correlations even if one has a statistically significant result and the other does not. Here’s an example the authors of Ten Common Statistical Mistakes shared about how this may happen:
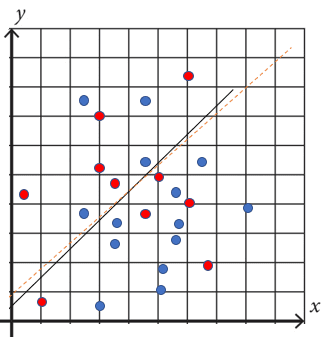
The above image shows two groups (blue, red) that share a similar correlation. However, if you were to compare correlations to zero with Pearson’s r [no term], it’s possible to find that one group has a statistically significant correlation while the other does not. If you were to conclude that the groups correlation’s differ based on this analysis, you would be wrong.
The solution is to only compare groups directly. Once you break the groups apart and start comparing them to something other than the other group (like zero or a hypothetical mean), you’re going to run into problems. Correlations can be compared with Monte Carlo simulations. ANOVA may also work for group comparisons.
2. P-hacking
If you get a large p-value [no term] from your analysis, but were expecting a small (i.e. significant) one, don’t be tempted to use hacks in the hunt for significance. For example, don’t be tempted to:
- Add covariates,
- Remove outliers or other data points post hoc,
- Switch outcome parameters,
- Vary the analysis pipeline.
All of these make it more likely you’ll get significant results, which means it’s more likely you’ll get a false positive result. To ensure your results are solid, make sure to follow standard analytic approaches–and don’t deviate from the plan once you’ve started. If you do decide to make changes after you’ve started, make sure to delineate planned from exploratory findings. If possible, repeat the process with a replication study to confirm your results.
3. Circular Analysis
Circular analysis is “any form of analysis that retrospectively selects features of the data to characterise the dependent variables, resulting in a distortion of the resulting statistical test” [1]. In essence, it involves recycling data or “double dipping” to get what you want. For example, splitting the data set into subgroups, binning or otherwise reducing the complete data set. This is fine when you are planning your analysis, but never sort. filter or tinker with your data set during analysis unless you’re clearly using exploratory methods. Otherwise you run the risk of distorted results and invalid statistical inferences.
To avoid circular analysis, define the analysis criteria in advance and independently of the data. Alternatively, use bootstrapping to to specify parameters and test predictions on a different dataset (or a subset of the dataset) .
4. Small Sample Sizes
Small samples are tricky and come with problems like:
- Bigger, biased, effect sizes for significant effects,
- Potentially missing effects (Type II error),
- Problems assessing normality (an assumption for many parametric tests),
- P-values have limited practical value.
There’s no “magic number” for how small is “too small”, but use caution with parametric tests if you only have a handful of data points. To avoid issues with small samples, consider using Bayesian statistics to determine the power for an effect post hoc. Also consider replication studies to confirm your findings.
References
[1] Ten common statistical mistakes to watch out for when writing or re…