
Graphs belong to the field of mathematics, graph theory. For data analysis that requires searches of particular patterns, graph-based data mining becomes an important technique. Indeed, in real life, most of the data we have to deal with can be represented as graphs. A typical graph consists of vertices (nodes, cells), and of edges that are the connecting lines between the nodes. Analysis of graphs includes determining certain details about the graph structure. For example, determining all routes or the shortest paths between two nodes or cells.
DMelt (http://jwork.org/dmelt) supports the following graph libraries
- Medusa-visualisation (via the Java class jhplot.HMedusa)
- JGraphT library (via the Java class jhplot.HGraph)
- JGraphX library
- Jung library
These libraries support graph creation using cells and edges, as well as their visualization. DMelt integrates these Java libraries into a scripting framework, such that complete Java API of these libraries can easily be accessed via the Python, Ruby, Groovy and BeanShell scripting languages. Of course, you can program graphs using the native (for these libraries) Java language. Read more information in DMent online manual (Graphs)
Below we show a few codding snippets to program graphs. We assume that you run the free version of DMelt Java program. Start its editor by running dmelt.sh (Linux/Mac) or dmelt.bat (double click, Windows)
from jhplot  import *
g=HGraph().buildDirectedGraph()
 v1,v2,v3,v4 = "v1","v2","v3","v4"g.addVertex(v1) # add 4 vertexes
 g.addVertex(v2)
 g.addVertex(v3)
 g.addVertex(v4)g.addEdge(v1, v2) # add edges
 g.addEdge(v2, v3)
 g.addEdge(v3, v1)
 g.addEdge(v4, v3)
 HGraph().showGraph(g) # show the graph in GUI
And run this code in the editor. You will see a pop-up window with this image: 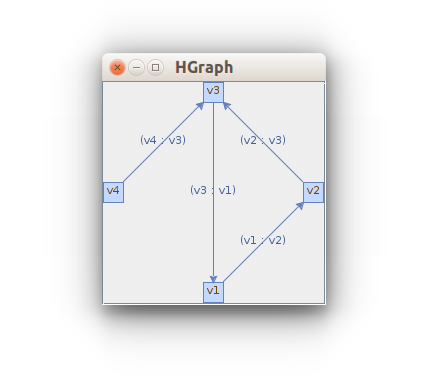
Now you can do various manipulations with this graph using the JGraphT library. In particular, you can create graph with weights and run clustering algorithms, or algorithms that determine shortest path and so on. Other libraries, Medusa, JGraphX, Jung are incorporated in DMelt as a backbone for data mining in graphs using scripting environment.
There are a few advantages in using this approach. First, you use a platform independent environment (Java). You can use Python scripting, and still using Java by calling powerful Java visualization, You can also program in Java, which is widely considered as #1 programming language in industry, and deploy it as jar library. In fact, according to tiobe-index, Java and Python have 20% popularity index, significantly higher than any other programming language.
Here is another example using the Medusa library. Now we will read a complex graph from the web, and run the k-means clustering algorithm on its nodes. The code below prints the result of the clustering procedure:
from jhplot import *
http="http://jwork.org/dmelt/examples/data/"
 print Web.get(http+"sample1_medusa.dat")
 c=HMedusa()
 c.loadFile("sample1_medusa.dat")
 gg=c.getGraph()
 c.visible()    # show the graph
 from medusa.georgios.ClusteringAlgorithms import KMeans2
 kmeans = KMeans2(6, gg) # k-means with 6 clusterskmeans.runKMeans()
 print kmeans.getReport()