
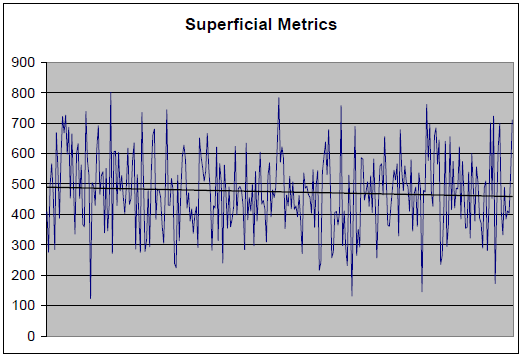
Something that has always troubled me with statistics is the pretense of certainty. The conclusions – being closely associated with calculations – tend to be reached rapidly. I might only be starting to give a problem some thought – although a statistician has already drawn conclusions. Over time, this can make a person feel insecure about his intellectual capacity – and perhaps cause him to write a blog on the subject. Consider the simulated data below: a special program was implemented by a fictitious organization near the middle of the data collection period. The question is whether this event or change contributed to an increase or decrease in sales. The scale for sales in units is on the y-axis. I will advise readers in advance – since this is a controlled simulation – that in fact the change contributed to an increase in sales. However, there is clearly a downtrend in sales. How can my assertion be correct?
I offer below the section of code that gave rise to the aggregate data. In real life, sales can be affected by many factors. Some factors might include the following: 1) the persuasiveness of the agent; 2) their handling speed and proficiency; 3) usual willingness of the market to be persuaded; 4) usual seasonal changes in the size of the market; and 5) the effectiveness of marketing campaigns. Given the pinpoint suddenness of the implementation, it is reasonable to regard this scenario as a marketing campaign to increase sales. (The impact of marketing on sales could be tested by determining how many clients were exposed to the marketing; how many of them subsequently entered into a sales contract; and the extent to which the rate of success differs from the ambient. However, I don’t plan to get into this depth of analysis.)
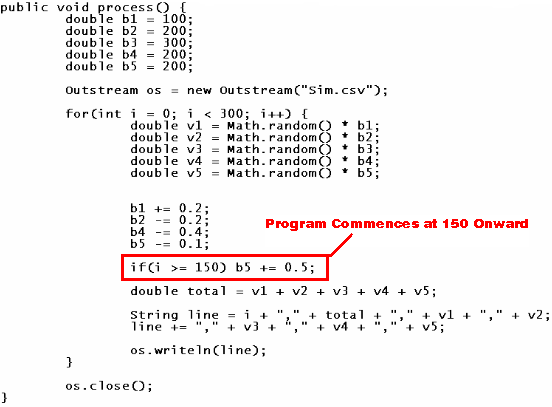
In this simulation, based on the code above, there are five variables giving rise to the sales data. The marketing campaign occurs in the middle of the data. The marketing campaign is successful: note how b5 is increased by 0.05 per cycle from the 150th day of operation onward – thereby making increases in v5 more likely. Consequently, if a statistician after examining the superficial metrics at the beginning simply said that the campaign is unsuccessful, this individual would be incorrect. Yet I admit that it is challenging to determine how improvements to v5 can be determined from the sum of v1, v2, v3, v4, and v5. The point I want to make in this blog is that although this is a business problem – it is not actually a mathematical problem. The main challenge is deconstruction: ascertaining which aspects of operations to recognize as relevant or significant in relation to the metrics in question.
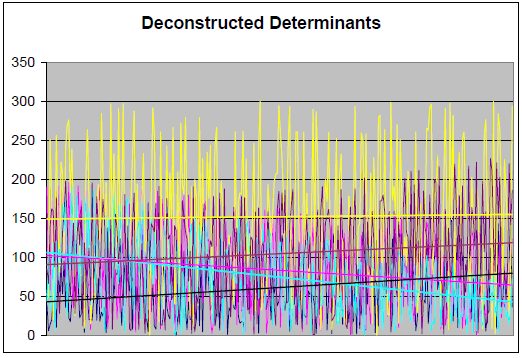
The good news is that the real work – where a human should get paid to do the job – is extremely difficult for a computer to do. The work done by a machine can and likely will be done by a machine. People probably won’t get paid to do that kind of work much longer. I recognize that there might be a great deal of conflation, confusing the non-creative process of calculation with the high levels of creativity needed to solve the business problem. Before I begin to stray from the point at hand, let us consider the how the different contributing metrics appear together on a chart. Since this is a busy chart for sure, I would focus on the trendlines.
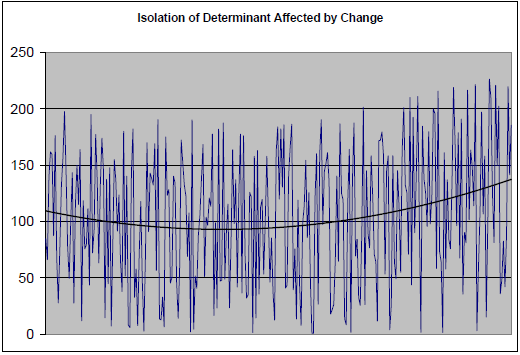
I isolated v5 on the chart below. I also applied a polynomial trendline to show that simulation is working as intended. The implementation of the program therefore is indeed beneficial to v5. The best course of action, assuming the costs do not exceed the benefits, is to continue the program. Halting the program would likely reduce the number of units sold by the company – thereby adding to its already declining sales. While the program does not stop the decline, it reduces the overall pace of that decline.
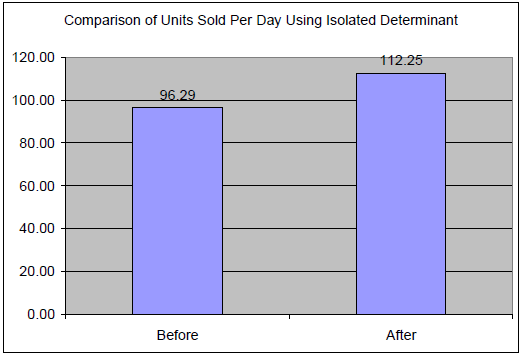
For me, one of the most straightforward ways to determine the effectiveness of a program on a particular component of sales is simply by comparing averages (refer to the bar chart below). I haven’t found a perfect approach. In real life, it is unlikely that the program or a single aspect of it exclusively brought about the change in sales. For example, maybe the focal point should be the marketing period (dates of advertising); the location of the target audience; the specific manner of advertising; the particular incentives being advertised; or the type of audience. We therefore don’t leave it at, “Yes, the campaign was effective.” It would be better to say, “We need to determine what specific aspects of the campaign were effective.”
It is possible for an advertising campaign to stop working. There is a constant need to obtain fresh data, to do new analysis, and to speculate on the best courses of action. Doing some kind of super-computer calculation – as if the outcome is definitive, absolute, and unchanging – seems far from prudent. So with all due respect to super-computer enthusiasts, there are limits to how far these powerful tools can be applied. The multi-dimensionality of business problems creates a need for creativity – maybe making use of different levels of thinking. The calculations might be important to the problem as it is posed. But the problem as it is posed might be unrelated to the solution. The posing of the problem – its recognition, attribution, construction, and articulation – might in itself add distance to the solution, making it inaccessible no matter how many calculations are performed.