
 The Arthur Ross Terrace & Garden at Cooper Hewitt, Smithsonian Design Museum. Photo: Agaton Strom Photography[/caption]
Introduction
The Cooper Hewitt Design Museum houses an impressive collection of designed objects that chronicle the history and significance of design in our evolving world. These objects range from unrealized works of architecture to handwoven textiles from Africa to graphic designed posters that reflect the culture and pulse of humanity of their time.
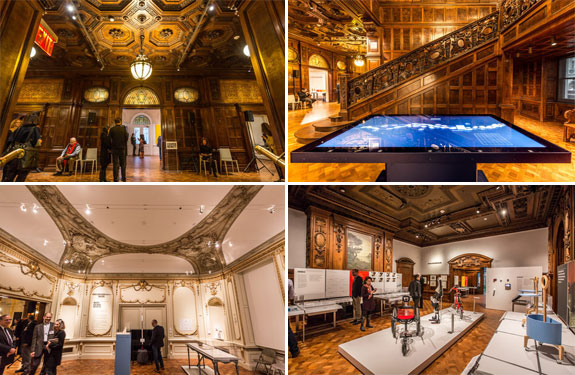
The museum is housed in the former mansion of Andrew Carnegie. Upon its completion in 1901, the sixty-four room mansion was the first private residence in the United States to have a structural steel frame that allowed for more expansive spaces and a feeling of lightness. The Carnegie Mansion was also the first private residence to have a residential elevator, central heating, and a precursor to central AC. This legacy of innovation carries through today and is vibrant in the most recent renovation and reconceptualization of the museum.
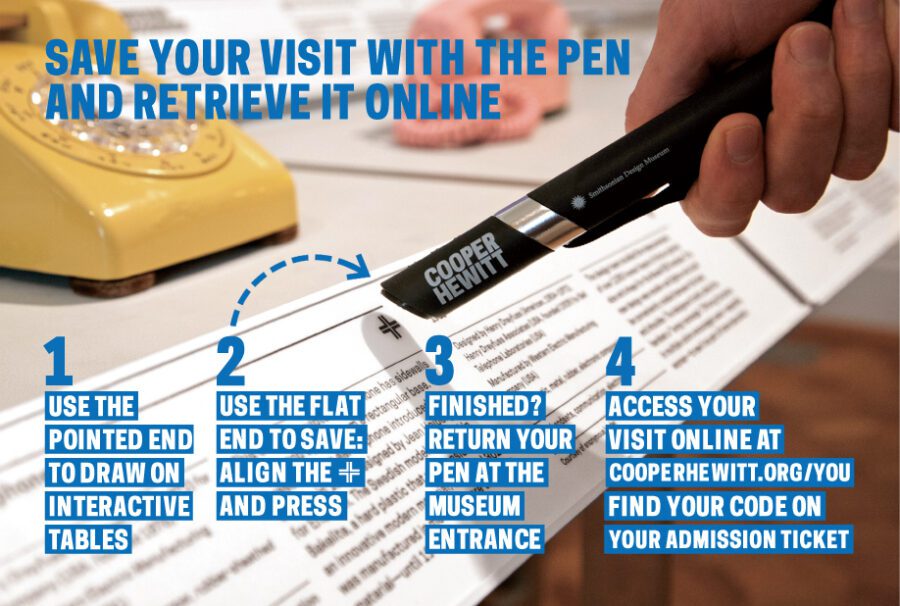
Furthermore, data collected from The Pen provides some exciting opportunities for analysis and inquiry:
- What departments have the most objects?
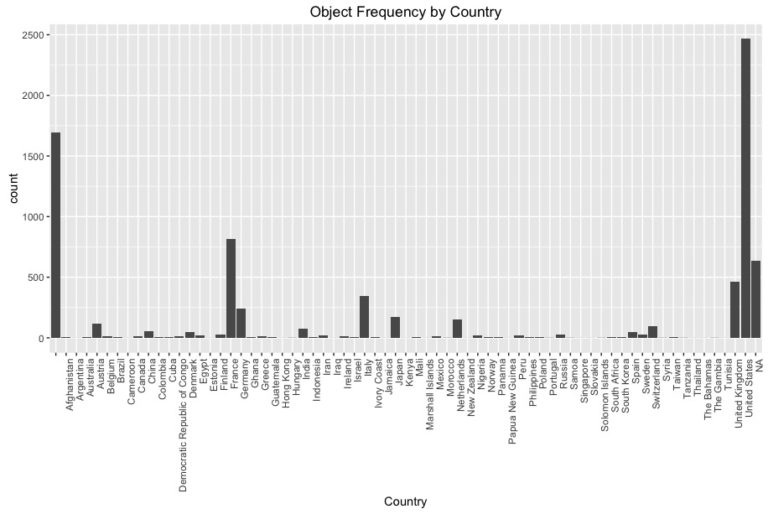
- Where do most of the objects in the collection originate from?
- What objects are scanned the most?
- What types of objects are scanned the most?
- Does an objects location in the museum influence if it gets scanned?
- Can we predict areas of interest of a visitor or their profession? Would this information help inform curators for future exhibitions?
The API developed by the museum is a phenomenal opportunity for anyone interested in the museum to access their collection, exhibitions, cafe openings, graphic color schemes, or integrate museum information in apps.
Play with the recommendation app prototype.
Learn more about the Cooper Hewitt Museum API.
Explore the Cooper Hewitt Museum github repository. So much to play…
Reference Documents:
The Data
The data was collected from the Cooper Hewitt’s github repository as a snapshot of the collection items that have been digitally archived. This did not include all of the items in their collection as they are constantly updating the repository. Two CSV files were downloaded and imported as data frames into R:
Objects data frame:
- 194,316 total objects in the collection
- 38 features: ID, country of origin, tags, type, medium, museum department, dimensions, description, primary image url, historic period, accession number, gallery text, on_loan, year acquired, etc.
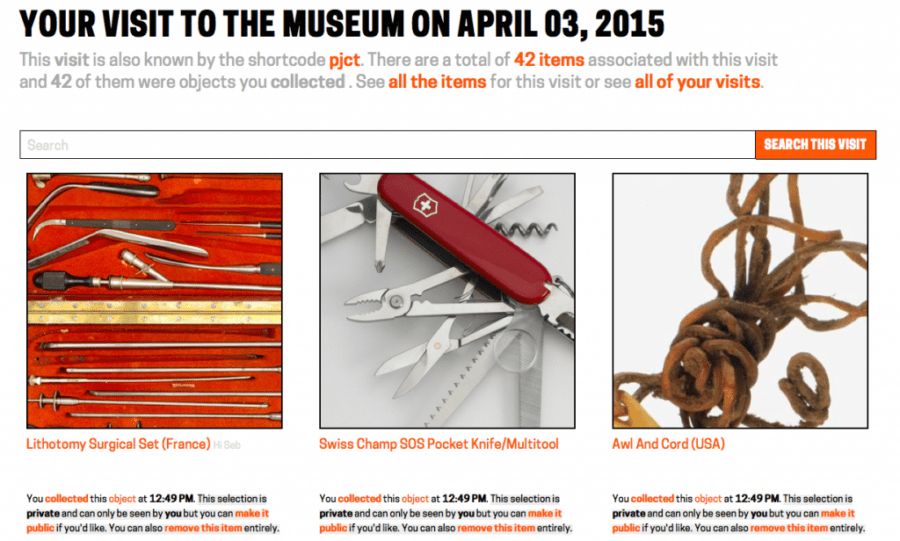
Visitor Pen Data:
- 3,559,735 scanned items between August 16, 2014 to February 15, 2016
- 584 days / 1.5 years of pen data
- 111,467 unique visits
- 7,784 unique objects out of 194,316 total objects scanned
There were some challenges with the object data frame features; namely tag, medium, type. I had hoped to use these features to do basic EDA to understand the distribution of collection based on medium or type; i.e. to understand if the collection was predominantly architectural, graphic design or textiles, etc. Unfortunately these features were not useful in analysis because they were not distinct categories but rather the multitude of unique values too vast to be useful. For instance, the feature type contained 6 different variation for a category glass of which their distance values were differentiated by capital and lowercase letters.
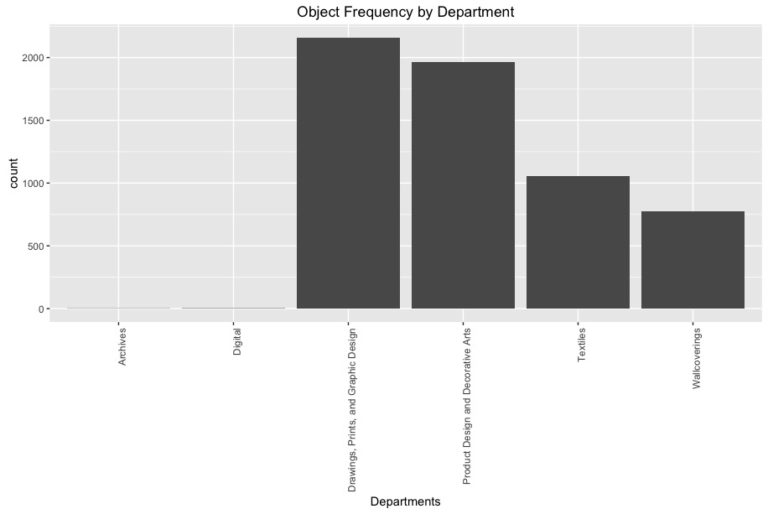
Of the useful and distinct features Department and WOE Country (country of origin) basic EDA reveals the distribution of objects mostly in Drawing, Prints and Graphic Design with most of the objects originating from the US, France, Germany, and Italy. With a bit of knowledge of design history this makes sense with the influence of the Italian Renaissance, German Bauhaus movement, the French Beaux-Arts, and contemporary design of the the Americas.
The visitor pen data consisted of a data frame with two features: bundle ID (unique visit ID) and object ID. If a visitor scanned more than one item each item (or scan) was recorded as an observation along with its corresponding bundle ID.
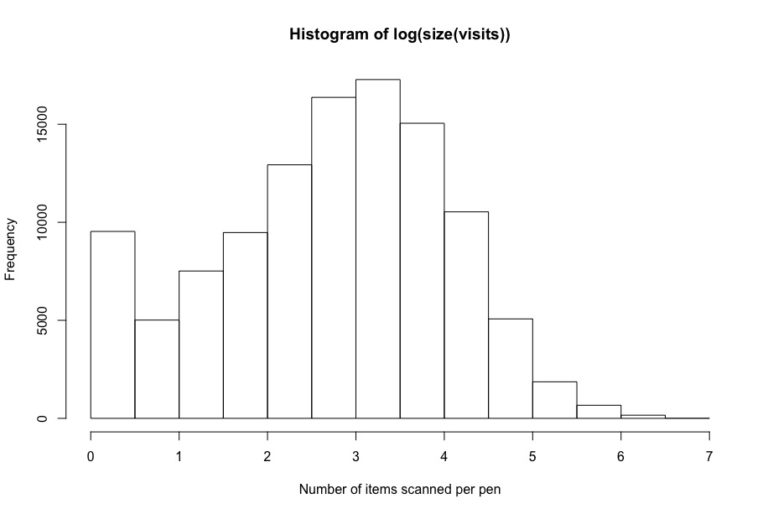
Basic EDA with pen data also reveals that on average visitors scan approximately three to four items per visit.
Collaborative filtering + Association rules
Collaborative filtering and association rules were researched in implementing the recommendation system with collaborative filtering being the method utilized in the shiny app prototype. Recommenderlab, the package used to apply collaborative filtering, provides an infrastructure to test and develop recommender algorithms which includes association rule-based algorithms. There has been extensive research into recommendation systems that use large data sets of user elicited rating data (i.e. ratings of 1 to 5 stars) while limited research exists where no large amount of directly elicited rating data or sparse, binary data is available. The methods tested for creating a recommendation system for the Cooper Hewitt Museum were:
- Popular, recommendations made based on popular items
- Association Rules, recommendations made on relationships found amongst items in the collection
- User-Based Collaborative Filtering, recommendations made based on what other similar users liked
- Item-Based Collaborative Filtering, building off of association rules recommendations are made on relationships found between items.
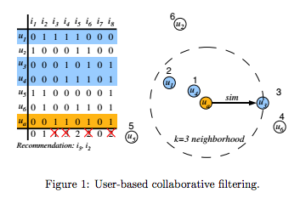
User-Based Collaborative Filtering is a memory based algorithm that makes recommendations based on patterns of similar users, or neighbors, that are identified by employing k nearest neighbor algorithm. A sparse binary matrix is constructed with columns representing unique items, rows representing each user, and populated with 1 if the user ‘liked’ the object or 0 if otherwise. All columns are summed up, the k nearest neighbors are identified (highlighted in blue), items liked by the active user are removed from the recommendations (red ‘x’) and recommendations for the active user (highlighted in yellow) are made of the remaining items in which their sum is greater than 0. A detraction of this method is its computational cost. All data must be read into local memory and similarities calculated between all users. My attempts at training a User-based CF model were unsuccessful as all session were timed out.
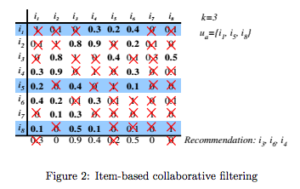
Item-based Collaborative Filtering is a model based algorithm that makes recommendations based on relationships between items in the rating matrix assuming the active user will like items that are similar to the items they liked. Like association rules mining, a similarity matrix is constructed with unique objects in each row and column and populated with similarity measures determined with either cosine similarity or Pearson correlation. Items that are similar to the ones liked by the active user (highlighted in blue) are identified and columns summed up. Items that were liked by the active user are removed (red ‘X’) and remaining items with sum greater than 0 are recommended.
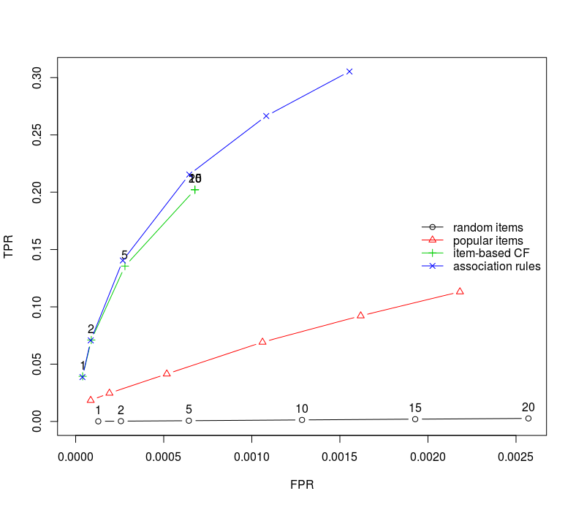
The recommenderlab package allows the combination of several trained algorithms into a hybrid model. After training individual item-basedCF and AR models successfully with recommenderlab I trained a hybrid model that attempted to combine user-basedCF, item-basedCF, AR, random and popular methods. Although I was able to train the hybrid model, making predictions was unsuccessful and errors returned. Evaluation of the hybrid model and its methods are depicted in the ROC curve graph below. Association rule mining out performed the other methods with item-based CF coming in close. It is a concern that the TPR of the overall model is low and is cause for further investigation but my inclination is that this is due to the extreme sparsity of the binary matrix.
A detraction of the recommenderlab is that I could not inspect the rules that the AR method of recommenderlab finds and therefore the arules package was employed to train additional model for analysis. Utilizing the same pen data, an AR model was learned, yielding 1218 rules from parameters support = 0.075 and confidence = 0.8.
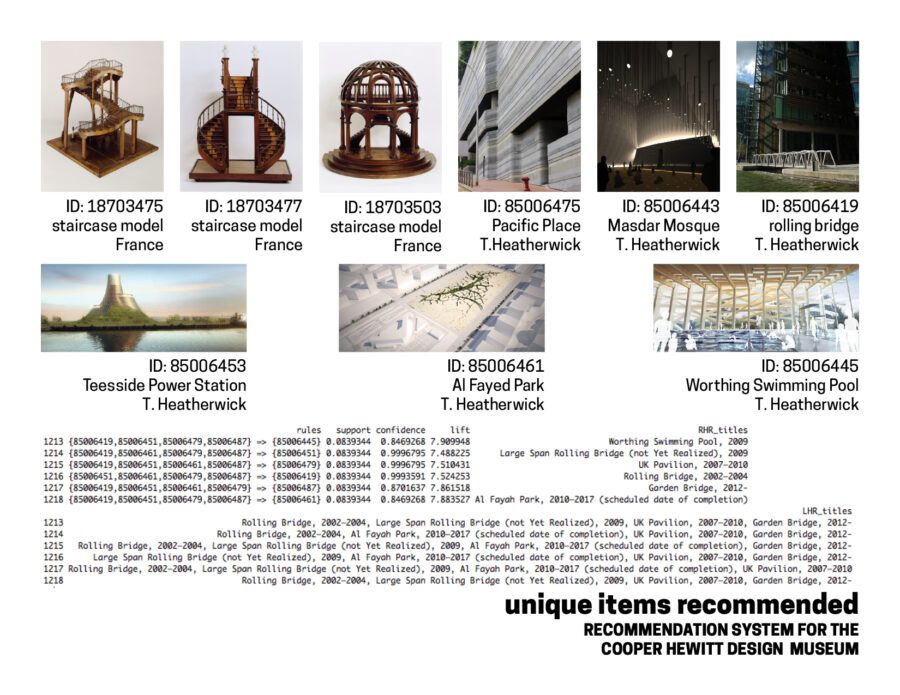
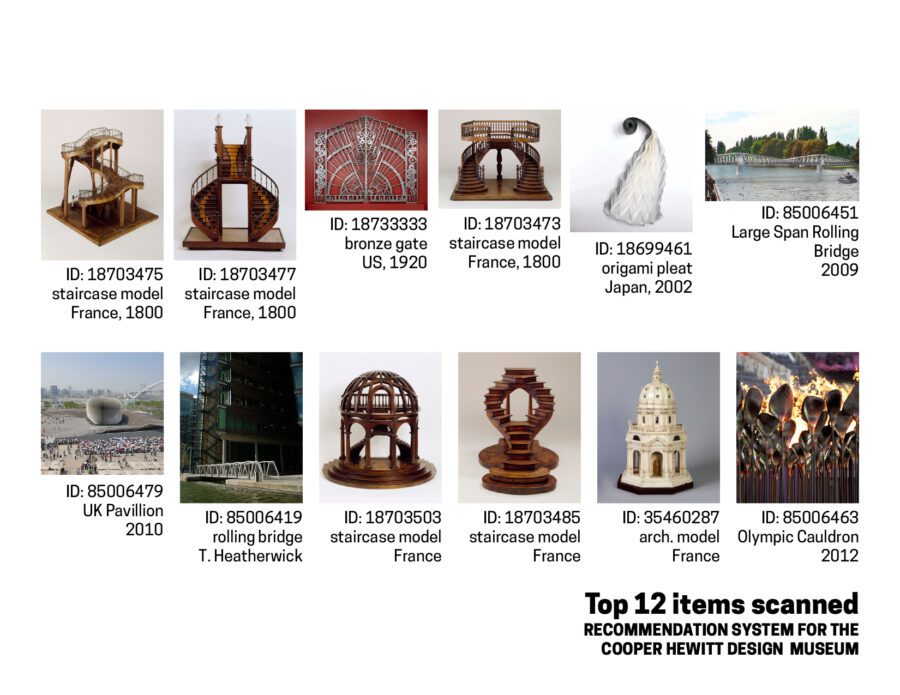
Upon inspecting the most recommended items I found them to be mostly architectural and was curious as to what might be causing this. After comparing them to the top 20 items scanned or ‘liked’ the recommended items seemed logical as the most scanned items are in fact architectural in nature as well.
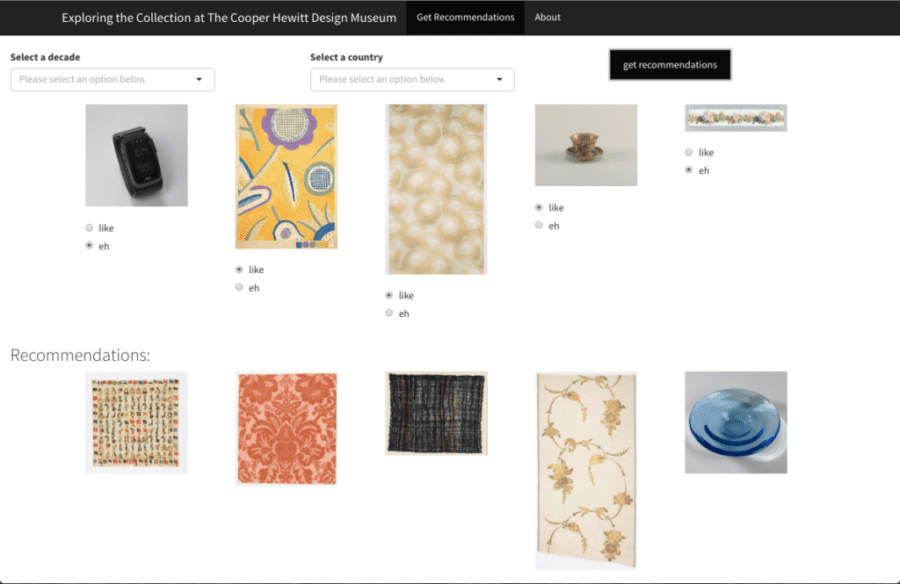
The Shiny App
A prototype was implemented in shiny to simulate how the recommendation system might work. The active user is shown 5 images in which they can select ‘like’ or ‘eh’ if they don’t find the object that interesting. From these selections the app will return five recommended objects utilizing the item-based collaborative filter algorithm. The active user also has the option to subset the items shown based on a particular decade they are interested in or objects from a particular country of origin. Play with the recommendation app prototype.
Future Developments
- Refine graphics and interactive elements on the app:
- show object info when hovering over images
- object name shown with the image
- allow the user to select the number of recommendations given
- Integrate API calls to make the objects suggested and recommended reflective of the objects current in the digital archive
- Implement NLP on tags and types to get more distinct classifiers to improve recommendations or allow filtering
- Utilize the pen data to predict visitors areas of interests or profession based on the items they scanned. Can this information be helpful to museum curators as they plan for future exhibitions?
- Conduct spatial analysis to find if and how much an objects location within the museum has on how many scans it receives.
- Create an exploded axonometric of floorpans with objects mapped to their locations to
- visualize and facilitate spatial analysis.
Gratitude
In the spirit of prominent cultural institutions, I would like to thank the following individuals for their generous contributions of support in bringing this project to life: Zeyu Zhang, Kyle Szela and his BFFL Joe, Ho Fai Wong, and Christopher Peter Markis for their continued encouragement and brilliance throughout this project.