
This blog will cover the following “Future of Smart” initiative topics:
- Create a common definition or description of what it means to become “smart” and rally the organization around that definition. Confusion in definitions and terminology may be the #1 killer of organizational alignment and corporate innovation.
- Start with a customer-centric perspective by creating Customer Journey Maps to validate the points of customer, product, operational and market value creation. Remember, customers are the source of value creation for any organization.
- Use facilitated envisioning techniques to identify, validate, value and prioritize the business and operational use cases that comprise a “smart” space.Organizations fail not due to lack of use cases; they fail because they have too many and don’t understand how to focus and prioritizethem.
Those “Future of X” images – where X = factories, hospitals, cities, oil platforms, agricultural farms, stadiums, wind farms, theme parks, retail malls, etc. – are really cool to look at, but really overwhelming when you start to think about where and how to digitally become “Smart” (see Figure 1).
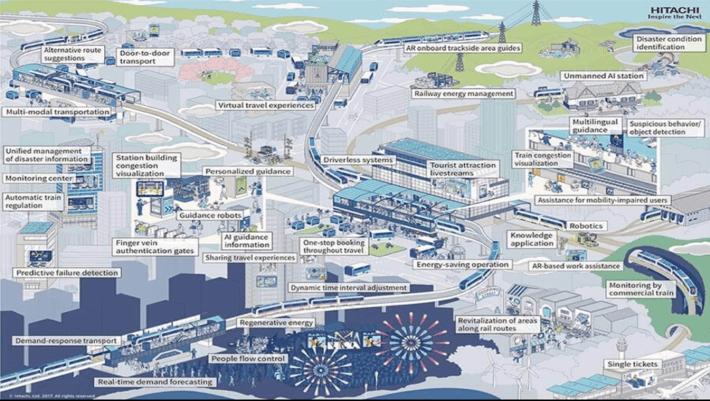
Figure 1: Hitachi Smart Rail Services Vision
But being “smart” is much more than just about collecting data. Being able to capture, store and manage the data created by connected devices and humans creates amazing possibilities, but that data in of itself isn’t useful.
Data is a latent asset that needs refining and blending to become actionable. Data needs analytics to identify and quantify the tendencies, inclinations, relationships, associations and patterns in the data that can be used to derive and drive new sources of business and operational value. Just having the data is insufficient. Data needs analytics to become “smart”.
Smart: Transitioning from Data-centric to Action-centric
The first thing we need to do is to define what we mean by “smart.”
“Smart” is the sum of the business or operational use cases – and their supporting optimized decisions – that compose an entity’s business or operational objectives.
Next, we want to embrace a process that transitions the organizations from just focusing on collecting data, into a process that seeks out the sources of customer, product and operational value. We will leverage the customer journey map to help us identify those sources of value creation (see Figure 2).
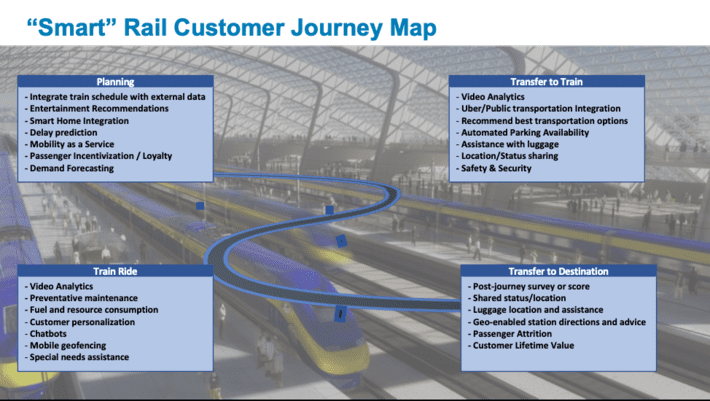
Figure 2: Smart Rail Customer Journey Map
A customer journey map depicts the stages customers go through when interacting with a company, from buying products online to accessing customer service on the phone, to airing grievances on social media. The Digital Transformation Customer Journey Maphelps organizations identify where and how to apply their digital assets to digitally transform their key business and operational processes, products, and assets to improve efficiency, enhance customer value, manage risk, and uncover new monetization opportunities.
Envisioning Smart and “Thinking Like a Data Scientist”
Identifying, validating, valuing and prioritizing the use cases that comprise an organization’s “smart” journey takes close collaboration with the subject matter experts who understand the key business and operational decisions that must be optimized to achieve “smart”.
Having machine learning, deep learning or artificial intelligence technologies is insufficient in making something “smart”. Technology isn’t “smart” unless it leverages the organization’s data to enable a business decision or outcome that drives financial, operational or customer value. A refrigerator isn’t “smart” because it has a screen that tells me the time and the news – that’s just replicating something I already have clinging to my wrist. A refrigerator won’t be smart until it tells me when my food will spoil, what I can cook with the groceries I have, or when the cooling coils are degrading and maintenance is required.
Unfortunately, most business stakeholders don’t understand how data and advanced analytics can support those key decisions; they struggle to envisionthe realm of what’s possible with respect to how data (Big Data, IoT) and advanced analytics (machine learning, deep learning, reinforcement learning, artificial intelligence) can impact the organization’s key use cases.
In order to help the business stakeholders understand the realm of what’s possible, we developed the “Thinking like a Data Scientist” methodology (see Figure 3) to drive that collaboration with the business stakeholders to:
- Identify the right decisions to make, predictions to create, and hypotheses to test
- Evolve from descriptive questions about what happened, to predictive questions about what is likely to happen and prescriptive questions about what actions to take
- Brainstorm different variables and metrics (data sources) that might yield better predictors of business performance
- Blend metrics and variables to create actionable “scores”
- Identify where and how analytics can optimize key business and operational processes, reduce compliance and security risks, optimize product performance, uncover new business opportunities and create a more compelling user engagement
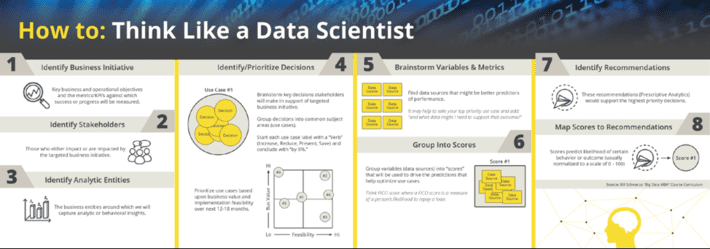
Figure 3: Thinking Like A Data Scientist methodology (click on image to zoom in)
Key deliverables from the “Thinking Like A Data Scientist” envisioning methodology includes:
Use Cases: Detailed explanation of the identified business or operational use cases, including business impact, the metrics or KPI’s against which use case will be measured. and implementation risks and considerations (see Figure 4).
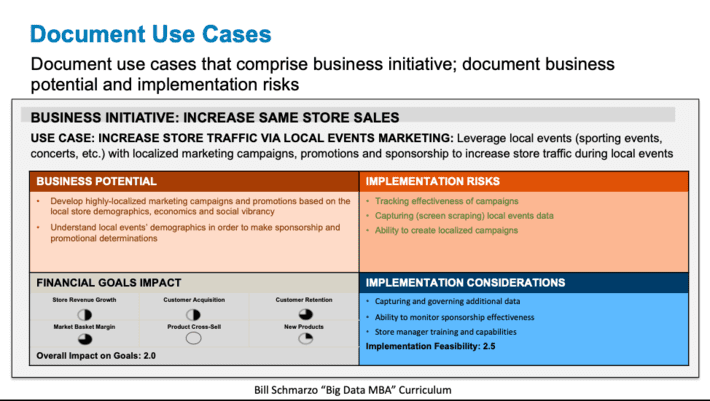
Figure 4: Documented Use Cases (click on image to zoom in)
Data Assessment. Next, we assess the business value and implementation feasibility of each of the brainstormed data sources. This is where we determine 1) the business value and 2) the implementation feasibility (over the next 12 to 18 months) of each of the data sources vis-à-vis the use cases (see Figure 5).
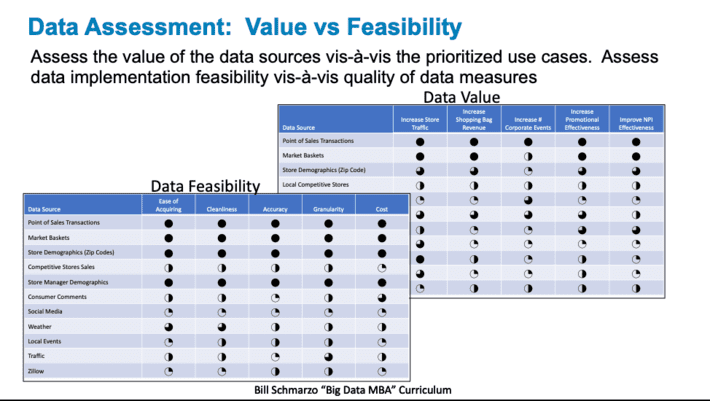
Figure 5: Data Assessment – Value versus Implementation Feasibility (click on image to zoom in)
Illustrative Analytics. With a small subset of relevant client data, we will create 8 to 12 different analytic models or algorithms to help business stakeholders to envisionwhat the data might hold with respect to customer, product and operational insights (see figure 6).
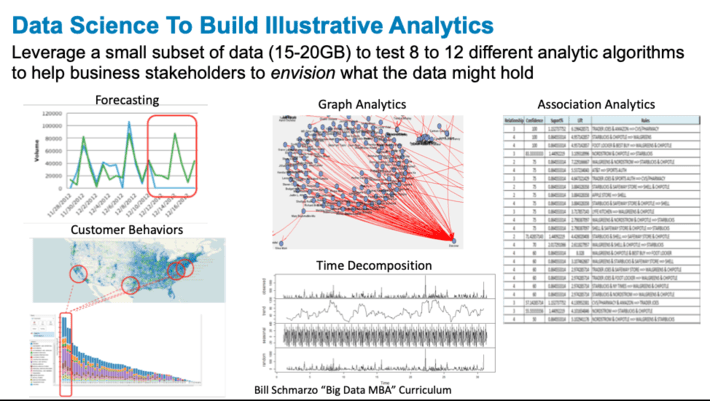
Figure 6: Illustrative Analytics
Prioritization Matrix. With each of these use cases now fully fleshed out, we are in a position to prioritize which use cases (or groups of decisions) we should undertake first based upon business value and implementation/execution feasibility (see Figure 7).
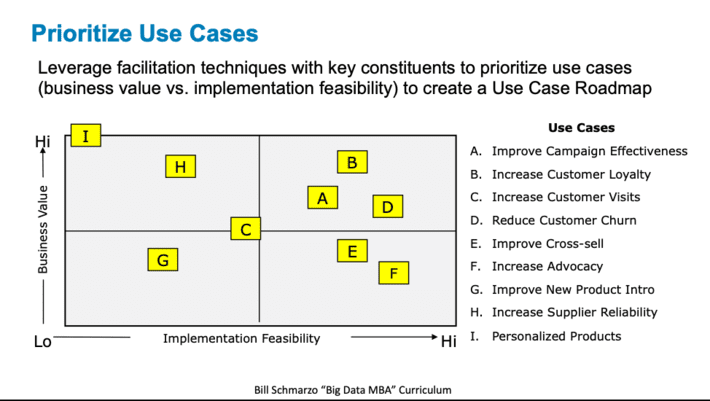
Figure 7: Prioritization Matrix
The Prioritization Matrix not only yields the right place to start from a “low hanging fruit” and positive ROI perspective, but also can yield a roadmap of which use cases to address in what order. This approach facilitates the accumulation of organizational knowledge with respect to their data and analytics that can be re-applied across multiple use cases.
Summary: Creating Smart
Creating “smart” takes a lot of upfront work which has little to do with technology, and everything to do with understanding the organization’s key business initiatives and the sources of customer, operational and market value. Identifying, validating, valuing and prioritizing the key business and operational decisions necessary to support the organization’s smart initiative is the starting point.
Making better decisions…now that’s how we become smarter!