
As you might realize by now, writing SQL queries is one of the essential skills any inspiring data analyst needs to master. After all, larger datasets are typically stored in relational databases and Structured Query Language is the language that helps us communicate with such databases. Sure, NoSQL is gaining prominence amid the growing popularity of nontraditional databases, but we need to learn to crawl before we start walking. Merely 10 years ago, you would need to download and install a RDBMS software package (be it MySQL, PostgreSQL, or SQLite), load a sample database and do a hundred pushups before you could write you very first SQL query. Luckily technology sprung ahead and we now have a plethora of web-based SQL editor options from SQL Lite Online to SQL Fiddle that eliminate the software setup step, but might still require us to load sample data. What if you wanted to access real-world big data sets from the comfort of your browser without having to download any software, no hassle, no trial, no credit card required? Well, you’re in luck, what follows is the beginner’s guide to Google BigQuery’s Sandbox. An active Google account is your cost of admission. BONUS: Machine Learning models are powered by nothing else but SQL are also included.
Before we get started, let’s get acquainted with some useful terms.
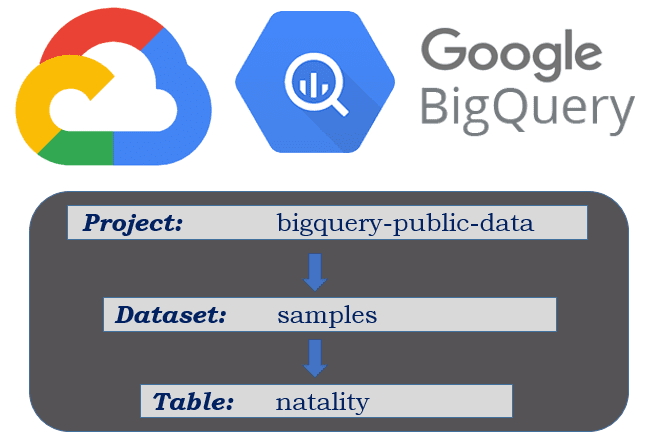
BigQuery is one of the leading serverless, scalable datawarehouse storage solutions, a major component of the Google Cloud Platform ecosystem. As you might recall, a database table is the depository of records, in which columns represent table fields and rows house actual records. If you ever worked with any data in Excel or any other spreadsheet processing software package, concept of a table will not be foreign to you. In GCP, a collection of tables is called a dataset. Finally, a project is a collection of datasets. This is important, because before Google introduced BigQuery Sandbox back in February of this year, you would need to set up billing in order to work with this tool. Before Sandbox, one would have to provide their billing information (credit card or a bank account required) to sign up for the free trial of BigQuery. This trial would end in 12 months or upon reaching $300 in costs, whichever came first. Both, the Sandbox, as well as regular BigQuery subscription come with always free 1 TB(!) of querying and 10 GB of storage per month. This is more than enough for most beginners making their first steps with the tool while practicing their SQL skills and interacting with large (and small) public datasets. Sandbox supports most of BigQuery features, including it’s Machine Language implementation – BigQuery ML, but it doesn’t offer inter-connectivity with other GCP products, limits default table life to 60 days, doesn’t support data manipulation language (DML) commands, and lacks data transfer and data streaming services. Should you run into limitations of Sandbox you can upgrade to BigQuery trial at any time.
On the subject of cost, one thing to keep in mind is that BigQuery is a columnar DBMS, which makes it rather expensive to query all of the fields in your table, even if you are limiting your query to just one record. Thankfully BigQuery provides a way to view a snapshot of your tables and views for free using their user interface. Such preview should help you zoom in on the columns of interest and limit the number of fields in your query, thus keeping your costs low or at zero.
Let’s get going:
Step 1 – Log in to your Google account
Step 2 – Navigate to BigQuery
Copy and paste this link into your browser to go directly to BigQuery console. Please note that at the time of this writing BigQuery supports both: classic user interface and (newer) Web interface. We will use Web UI in our example as the classic version is scheduled to sunset in June of 2020.
Step 3 – Accept terms of service
Enough said, Google wants to make sure that you accept whatever legalese they deem necessary to protect them from your legal actions.
Step 4 – Set up a new project
Follow a set of prompts to create a new project, which is a required step for your using this tool.
Step 5 – Resist (and refuse) obtrusive calls to action
Google is really not being shy about pushing a full version of this product onto you. In fact you will see not one, but two CTAs next to each other. I would dismiss both messages in order to free up much needed space, and to avoid an unwanted upgrade.
 Step 7 – Preview your records
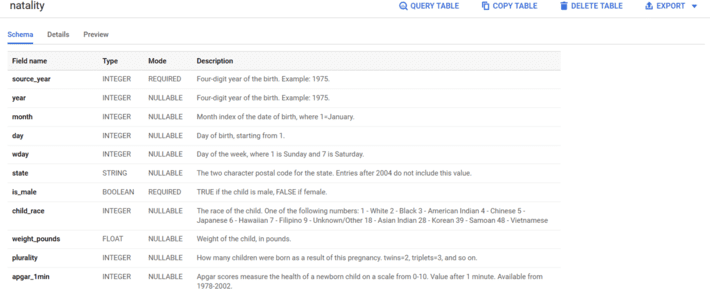
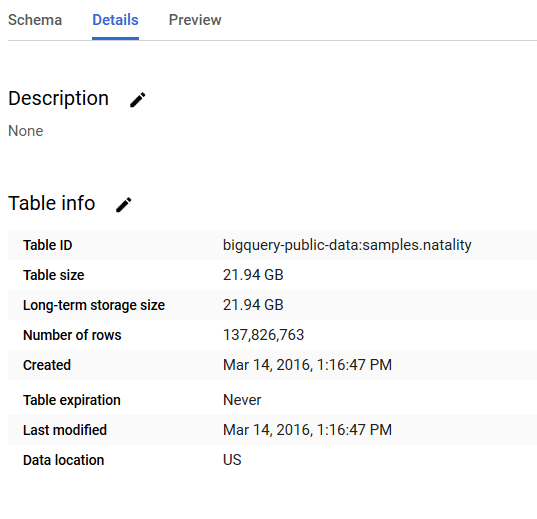
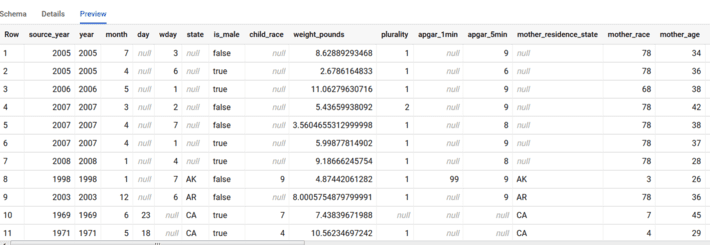
As discussed above exercising caution when retrieving data from BigQuery can yield considerable savings. Even more importantly, understanding your data is the key step in your data analysis process. Using Web UI we can: view table’s schema to explore all fields, determine field data type and read through data dictionary describing the purpose of each field; look at table details to assess the table size (and estimate cost of running queries against this table), and count number of record it houses; preview actual records without incurring any costs of querying our data.
Looking deeper into our table, year field is a four-digit year of Integer data type, while state is a two-character state abbreviation of String data type. There are 137.8 Million records in our table, which weights 22 GB. I don’t know about you, I wouldn’t want to work with such a dataset if it was housed in Excel.
Step 8 – Run our query
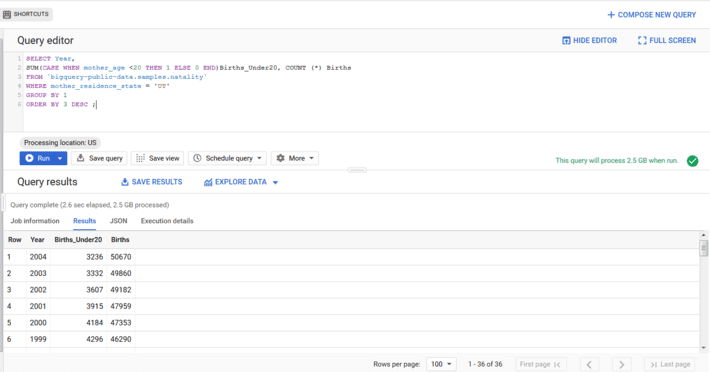
Next step is to define the question we want to answer using BigQuery data. Some ideas for this table can be found in our post from 2015 post on this topic. Let’s say that we want to retrieve number of births, and number of births by mothers under the age of 20 in Utah by year. We would then come up with the query below, type it in the Query editor window and click on blue Run button to execute our code. Prior to running we can also estimate the cost of this query since BigQuery console shows us that it would take 2.5 GB or 0.25% of our monthly quota to execute it.
SELECT Year,SUM(CASE WHEN mother_age < 20 THEN 1 ELSE 0 END)Births_Under20, COUNT (*) BirthsFROM `bigquery-public-data.samples.natality`WHERE mother_residence_state = 'UT'GROUP BY 1ORDER BY 3 DESC ; |
This is how our query and query results look like in BigQuery Web UI:
If you are looking for an Intro to SQL tutorial, stay tuned, this post is scheduled to be published in January.
Now that Google BigQuery Sandbox gives you the super powers of working with large datasets, how are your going to put it to a great use?
Article was originally published on author’s blog, here.