
My earlier article on ‘25 Big Data terms you must know to impress your date’ had a pretty decent response (at least by my standards) and there were requests to add more. Look, it is fairly easy to impress your date. Depending on the gender, all you may need is a romantic dinner and my ‘25 Big Data terms’ cheat sheet. To impress your parents and especially your father though, it’s a totally different ball game. That’s why I am upping my game to add at least 50 more terms. This may not be sufficient but it’s worth a try.
So if you haven’t yet bought your Dad a gift for Father’s day, practise these 50 additional words along with my first list of 25 terms and take him to a nice place for lunch or dinner. You might have a chance to redeem yourself in his eyes.
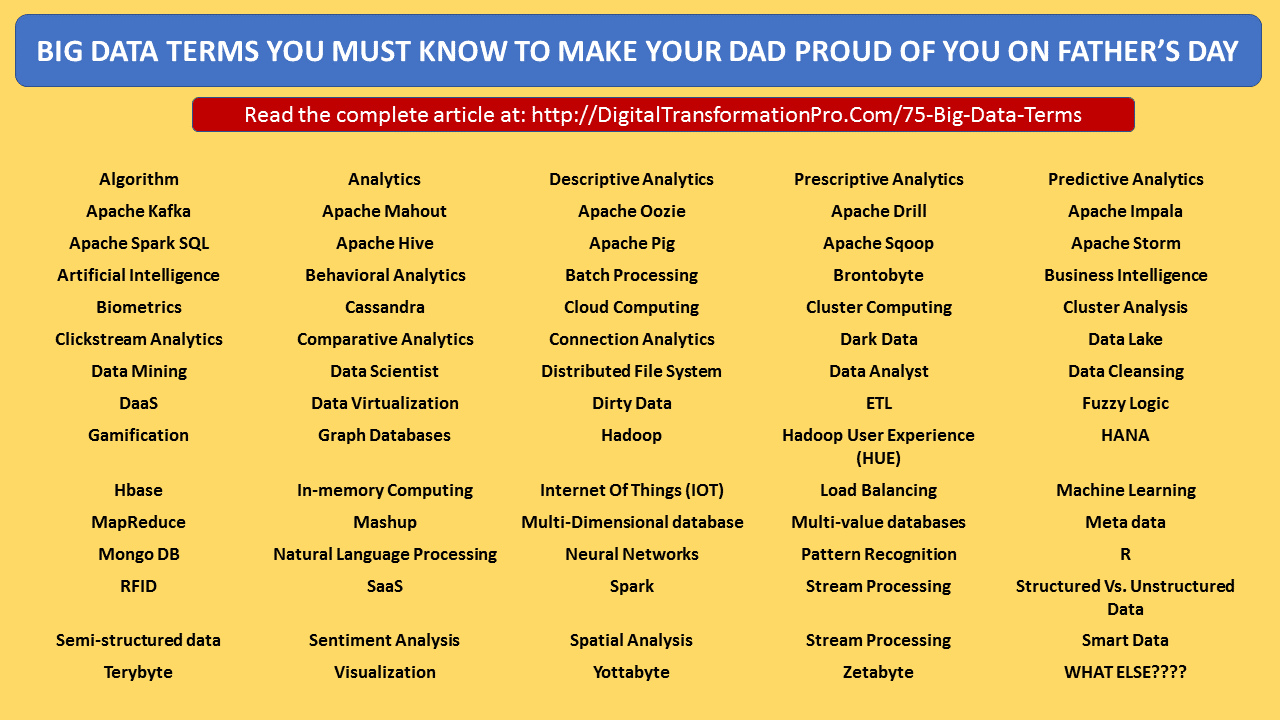
Just to give you a quick recap, I covered the following terms in my first article. Algorithm, Analytics, Descriptive analytics, Prescriptive analytics, Predictive analytics, Batch processing, Cassandra, Cloud computing, Cluster computing, Dark Data, Data Lake, Data mining, Data Scientist, Distributed file system, ETL, Hadoop, In-memory computing, IOT, Machine learning, Mapreduce, NoSQL, R, Spark, Stream processing, Structured Vs. Unstructured Data, Now let’s get on with at least 50 more big data terms.
Apache Software Foundation (ASF) provides many of Big Data open source projects and currently there are more than 350 projects. I could be spending my whole life just explaining these projects so instead I picked few popular terms.
Apache Kafka: Kafka, named after that famous cZech writer, is used for building real-time data pipelines and streaming apps. Why is it so popular? Because it enables storing, managing, and processing of streams of data in a fault-tolerant way and supposedly ‘wicked fast’. Given that social network environment deals with streams of data, Kafka is currently very popular.
Apache Mahout: Mahout provides a library of pre-made algorithms for machine learning and data mining and also an environment to create more algorithms. In other words, an environment in heaven for machine learning geeks. Machine learning and Data mining are covered in my previous article mentioned above.
Apache Oozie: In any programming environment, you need some workflow system to schedule and run jobs in a predefined manner and with defined dependencies. Oozie provides that for Big Data jobs written in languages like pig, MapReduce, and Hive.
Apache Drill, Apache Impala, Apache Spark SQL
All these provide quick and interactive SQL like interactions with Apache Hadoop data. These are useful if you already know SQL and work with data stored in big data format (i.e. HBase or HDFS). Sorry for being little geeky here.
Apache Hive: Know SQL? Then you are in good hands with Hive. Huve facilitates reading, writing, and managing large datasets residing in distributed storage using SQL.
Apache Pig: Pig is a platform for creating query execution routines on large, distributed data sets. The scripting language used is called Pig Latin (No, I didn’t make it up, believe me). Pig is supposedly easy to understand and learn. But my question is how many of these can one learn?
Apache Sqoop: A tool for moving data from Hadoop to non-Hadoop data stores like data warehouses and relational databases.
Apache Storm: A free and open source real-time distributed computing system. It makes it easier to process unstructured data continuously with instantaneous processing, which uses Hadoop for batch processing.
Artificial Intelligence (AI) – Why is AI here? Isn’t it a separate field you might ask. All these trending technologies are so connected that it’s better for us to just keep quiet and keep learning, OK? AI is about developing intelligence machines and software in such a way that this combination of hardware and software is capable of perceiving the environment and take necessary action when required and keep learning from those actions. Sounds similar to machine learning? Join my ‘confused’ club.
Behavioral Analytics: Ever wondered how google serves the ads about products / services that you seem to need? Behavioral Analytics focuses on understanding what consumers and applications do, as well as how and why they act in certain ways. It is about making sense of our web surfing patterns, social media interactions, our ecommerce actions (shopping carts etc.) and connect these unrelated data points and attempt to predict outcomes. Case in point, I received a call from a resort vacations line right after I abandoned a shopping cart while looking for a hotel. Need I say more?
Brontobytes– 1 followed by 27 zeroes and this is the size of the digital universe tomorrow. While we are here, let me talk about Terabyte, Petabyte, Exabyte, Zetabyte, Yottabyte, and Brontobyte.
Business Intelligence (BI): I’ll reuse Gartner’s definition of BI as it does a pretty good job. Business intelligence (BI) is an umbrella term that includes the applications, infrastructure and tools, and best practices that enable access to and analysis of information to improve and optimize decisions and performance.
Biometrics: This is all the James Bondish technology combined with analytics to identify people by one or more of their physical traits, such as face recognition, iris recognition, fingerprint recognition, etc.
Clickstream analytics: This deals with analyzing users’ online clicks as they are surfing through the web. Ever wondered why certain Google Ads keep following you even when switched websites etc? Big brother knows what you are clicking.
Cluster Analysis is an explorative analysis that tries to identify structures within the data. Cluster analysis is also called segmentation analysis or taxonomy analysis. More specifically, it tries to identify homogenous groups of cases, i.e., observations, participants, respondents. Cluster analysis is used to identify groups of cases if the grouping is not previously known. Because it is explorative it does make any distinction between dependent and independent variables. The different cluster analysis methods that SPSS offers can handle binary, nominal, ordinal, and scale (interval or ratio) data.
Comparative Analytics: I’ll be going little deeper into analysis in this article as big data’s holy grail is in analytics. Comparative analysis, as the name suggests, is about comparing multiple processes, data sets or other objects using statistical techniques such as pattern analysis, filtering and decision-tree analytics etc. I know it’s getting little technical but I can’t completely avoid the jargon. Comparative analysis can be used in healthcare to compare large volumes of medical records, documents, images etc. for more effective and hopefully accurate medical diagnoses.
Connection Analytics: You must have seen these spider web like charts connecting people with topics etc to identify influencers in certain topics. Connection analytics is the one that helps to discover these interrelated connections and influences between people, products, and systems within a network or even combining data from multiple networks.
Data Analyst: Data Analyst is an extremely important and popular job as it deals with collecting, manipulating and analyzing data in addition to preparing reports. I’ll be coming up with a more exhaustive article on data analysts.
Data Cleansing: This is somewhat self-explanatory and it deals with detecting and correcting or removing inaccurate data or records from a database. Remember ‘dirty data’? Well, using a combination of manual and automated tools and algorithms, data analysts can correct and enrich data to improve its quality. Remember, dirty data leads to wrong analysis and bad decisions.
DaaS: You have SaaS, Paas and now DaaS which stands for Data As A Service. DaaS providers can help get high quality data quickly by by giving on-demand access to cloud hosted data to customers.
Data virtualization – It is an approach to data management that allows an application to retrieve and manipulate data without requiring technical details of where it stored and how it is formatted etc. For example, this is the approach used by social networks to store our photos on their networks.
Dirty Data: Now that Big Data has become sexy, people just start adding adjectives to Data to come up with new terms like dark data, dirty data, small data, and now smart data. Come on guys, give me a break, Dirty data is data that is not clean or in other words inaccurate, duplicated and inconsistent data. Obviously, you don’t want to be associated with dirty data.Fix it fast.
Fuzzy logic: How often are we certain about anything like 100% right? Very rare. Our brains aggregate data into partial truths which are again abstracted into some kind of thresholds that will dictate our reactions. Fuzzy logic is a kind of computing meant to mimic human brains by working off of partial truths as opposed to absolute truths like ‘0’ and ‘1’ like rest of boolean algebra. Heavily used in natural language processing, fuzzy logic has made its way into other data related disciplines as well.
Gamification: In a typical game, you have elements like scoring points, competing with others, and certain play rules etc. Gamification in big data is using those concepts to collecting data or analyzing data or generally motivating users.
Graph Databases: Graph databases use concepts such as nodes and edges representing people/businesses and their interrelationships to mine data from social media. Ever wondered how Amazon tells you what other products people bought when you are trying to buy a product? Yup, Graph database!
Hadoop User Experience (Hue): Hue is an open-source interface which makes it easier to use Apache Hadoop. It is a web-based application and has a file browser for HDFS, a job designer for MapReduce, an Oozie Application for making coordinators and workflows, a Shell, an Impala and Hive UI, and a group of Hadoop APIs.
HANA: High-performance Analytical Application – a software/hardware in-memory platform from SAP, designed for high volume data transactions and analytics.
HBase: A distributed, column-oriented database. It uses HDFS for its underlying storage, and supports both batch-style computations using MapReduce and transactional interactive
Load balancing – Distributing workload across multiple computers or servers in order to achieve optimal results and utilization of the system
Metadata: “Metadata is data that describes other data. Metadata summarizes basic information about data, which can make finding and working with particular instances of data easier. For example, author, date created and date modified and file size are very basic document metadata. In addition to document files, metadata is used for images, videos, spreadsheets and web pages.” Source: TechTarget
MongoDB: MongoDB is a cross-platform, open-source database that uses a document-oriented data model, rather than a traditional table-based relational database structure. This type of database structure is designed to make the integration of structured and unstructured data in certain types of applications easier and faster.
Mashup: Fortunately, this term has similar definition of how we understand mashup in our daily lives. Essentially, mashup is a method of merging different datasets into a single application (Examples: Combining real estate listings with demographic data or geographic data). It’s really cool for visualization.
Multi-Dimensional Databases – A database optimized for data online analytical processing (OLAP) applications and for data warehousing.Just in case you are wondering about data warehouses, it is nothing but a central repository of data multiple data sources.
MultiValue Databases– They are a type of NoSQL and multidimensional databases that understand 3 dimensional data directly. They are good for manipulating HTML and XML strings directly for example.
Natural Language Processing: Software algorithms designed to allow computers to more accurately understand everyday human speech, allowing us to interact more naturally and efficiently with them.
Neural Network: As per http://neuralnetworksanddeeplearning.com/, Neural networks is a beautiful biologically-inspired programming paradigm which enables a computer to learn from observational data. It’s been a long time since someone called a programming paradigm ‘beautiful. In essence, artificial neural networks are models inspired by the real-life biology of the brain.. Closely related to this neural networks is the term Deep Learning. Deep learning, a powerful set of techniques for learning in neural networks.
Pattern Recognition: Pattern recognition occurs when an algorithm locates recurrences or regularities within large data sets or across disparate data sets. It is closely linked and even considered synonymous with machine learning and data mining. This visibility can help researchers discover insights or reach conclusions that would otherwise be obscured.
RFID– Radio Frequency Identification; a type of sensor using wireless non-contact radio-frequency electromagnetic fields to transfer data. With Internet Of Things revolution, RFID tags can be embedded into every possible ‘thing’ to generate monumental amount of data that needs to be analyzed. Welcome to the data world 🙂
SaaS: Software-as-a-Service enables vendors to host an application and make it available via the internet. SaaS providers provide services over the cloud.
Semi-structured data: Semi-structured data refers to data that is not captured or formatted in conventional ways, such as those associated with a traditional database fields or common data models. It is also not raw or totally unstructured and may contain some data tables, tags or other structural elements. Graphs and tables, XML documents and email are examples of semi-structured data, which is very prevalent across the World Wide Web and is often found in object-oriented databases.
Sentiment Analysis: Sentiment analysis involves the capture and tracking of opinions, emotions or feelings expressed by consumers in various types of interactions or documents, including social media, calls to customer service representatives, surveys and the like. Text analytics and natural language processing are typical activities within a process of sentiment analysis. The goal is to determine or assess the sentiments or attitudes expressed toward a company, product, service, person or event.
Spatial analysis– refers to analysing spatial data such geographic data or topological data to identify and understand patterns and regularities within data distributed in geographic space.
Stream processing: Stream processing is designed to act on real-time and streaming data with “continuous” queries. With data that is constantly streaming from social networks, there is a definite need for stream processing and also streaming analytics to continuously calculate mathematical or statistical analytics on the fly within these streams to handle high volume in real time.
Smart Data: Smart data is supposedly the data that is useful and actionable after some filtering done by algorithms.
Terabyte: A relatively large unit of digital data, one Terabyte (TB) equals 1,000 Gigabytes. It has been estimated that 10 Terabytes could hold the entire printed collection of the U.S. Library of Congress, while a single TB could hold 1,000 copies of the Encyclopedia Brittanica.
Visualization – with the right visualizations, raw data can be put to use. Visualizations of course do not mean ordinary graphs or pie-charts. They mean complex graphs that can include many variables of data while still remaining understandable and readable
Yottabytes– approximately 1000 Zettabytes, or 250 trillion DVD’s. The entire digital universe today is 1 Yottabyte and this will double every 18 months.
Zettabytes – approximately 1000 Exabytes or 1 billion terabytes.
To read original article, click Here
Hope this list was helpful. Please feel free to ‘Like’, ‘Share’ this list with your network, and ‘Follow’ me or ‘Connect’ for my future articles.