

In today’s technological world, data is everything. It can inform our marketing decisions, improve product creation, boost internal processes, and more. For an online business, having the best possible data is key to success.
But simply having data isn’t enough. To obtain useful information, you need to understand your data. That’s where web data analytics comes into play. With the right analytics tool, you can unlock your data and transform your business.
But what exactly is web data analytics, and how can it improve your website? We’ll explore this, and more, below.
What is web data analytics?
If you’re running an online business, you’re probably sitting on a mountain of data. Each time a user comes to your site, they’ll make interactions. This might include purchasing a product or signing up for a mailing list. These activities can be monitored and analyzed to help you better understand your audience.
Of course, to do that, you first need an Analytics tool. Google Analytics (GA) is the chosen option for a majority of sites. In fact, 56.7% of websites now utilize GA. It’s an ideal analytics tool for beginners. GA has a massive online community and many online resources to help you.
What’s more, GA is ideal if you manage multiple websites. You can create as many properties as you need using the tool.
Due to its popularity, this article will focus on features found in GA. There are, however, other analytics options available, including:
- Adobe Analytics
- Hotjar
- Matomo Analytics
- Clicky
So, without further ado, let’s examine some of the top ways that web data analytics can help you.
#1 – Use visualizations to inform website development
Tools like GA are packed full of reports containing many different insights. If you’re new to data analytics, these can be difficult to get your head around. If you’re not careful, you might feel overwhelmed by your data. This can lead to poor decision-making.
Luckily, visualizations are on hand to help you and your team better understand your data. Using visualizations, you can ensure better decision-making.
In GA, there are lots of forms of visualizations. Let’s look at some of the most useful examples.
Pie Charts
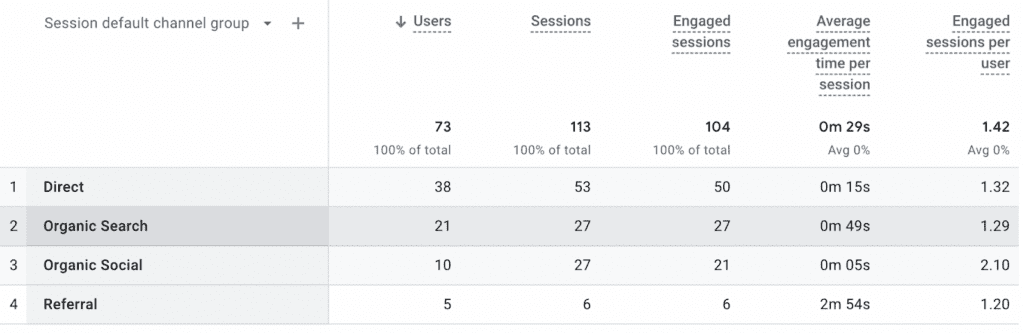
Image created by author
Pie charts are a simple way of sharing key insights. In GA, pie charts focus on one metric at a time, making data much easier to take in.
Let’s imagine that you want to view the top converting pages on your website. A pie chart can allow you to compare the performance of different pages in the blink of an eye. You can use the best-performing pages on your site as a model to optimize other pages.
Tables
Tables are the default visualization in GA. Dimensions and metrics are clearly laid out in different columns. The logical and simplistic style of this visualization makes data easy to understand.
Image created by author
Above is an image of a table from an acquisition report. From this table, we can clearly see the origins of different traffic sources, and the activities attributed to each. For example, we can see that 53 sessions came from direct traffic. By knowing the best-performing sources, we can better focus our efforts.
Comparisons
Sometimes in web data analytics, it’s necessary to compare two sets of data at once. Switching between reports can be time-consuming. What’s more, there’s a risk that you may misremember a certain statistic and make a false comparison. That’s why the comparison visualization is so useful.
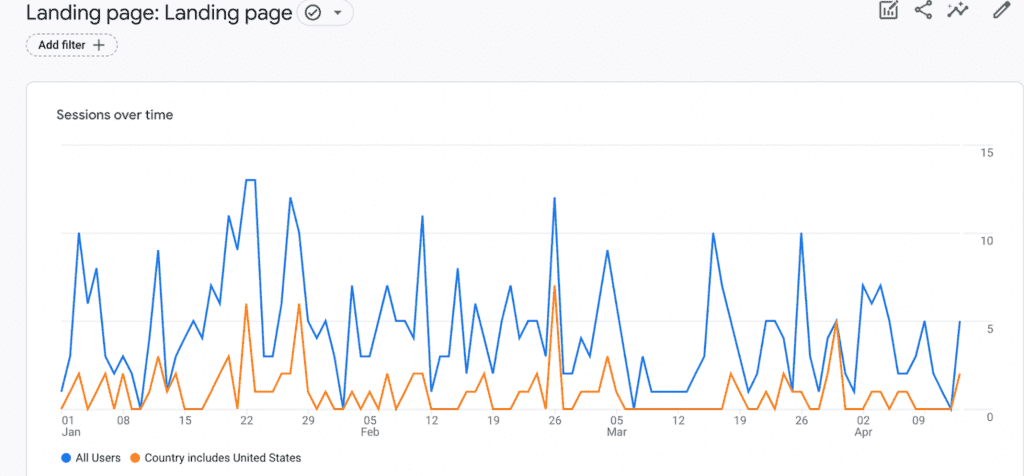
Image created by author
The image above shows an example of a comparison. We can see the number of US users that arrived on a landing page compared to the number of overall users. With a clearer understanding of the location of your users, you can tweak your marketing strategies.
Maximize Page Performance
To maximize page performance, it is crucial to analyze website data. In today’s technological world, data is everything. It can inform our marketing decisions, improve product creation, boost internal processes, and more. For an online business, having the best possible data is key to success. But simply having data isn’t enough.
To obtain useful information, you need to understand your data. That’s where web data analytics comes into play. With the right analytics tool, you can unlock your data and transform your business.
One such analytics tool is Kubio Builder. This is a powerful web data analytics platform that helps you track user behavior on your website, utilizing a user-friendly interface and advanced tracking capabilities, so you can better understand your audience and make data-driven decisions.
To maximize the benefits of web data analytics, partnering with a digital marketing agency, such as Brix Agency, can provide additional support in unlocking the potential of your data.
A great way to collect web data for analytics is through the use of unlimited bandwidth residential proxies, which can provide a pool of IP addresses that are difficult to detect and can help you gather information without getting blocked.
By leveraging these proxies, you can scrape more data without hitting rate limits or getting banned by websites that detect high traffic from a single IP address. This can give you a competitive edge by allowing you to gather more data than your competitors and gain deeper insights into your website’s performance.
For an ecommerce business, in particular, website data analytics is even more critical. Ecommerce website development can be complex, but with the right analytics tools, you can better understand your customers’ behavior and preferences, optimize your product pages and checkout process, and ultimately increase your conversion rates.
#2 – Segment data to personalize experiences
Lots of online businesses barely scratch the surface of their data. They don’t move beyond basic information, sticking with standard reports. These provide useful pieces of information. However, web data analytics can and should go much deeper.
Remember, customers want experiences that are tailored to them. Studies show that 49% of buyers will become repeat customers after a personalized experience. But to personalize, you need a strong understanding of your audience. This is where segmentation comes into play.
Segmenting is the process of breaking data down into smaller groups. Done in the right way, it can provide many useful insights into your audience. Below are some of the ways that you can segment your audience:
- Age
- Gender
- Location (Country, district, city)
- Industry
- Customer vs prospect
Go a step further with micro-segmentation
Simple segmentation can provide you with lots of basic audience insights. However, you can take it a step further. Instead of segmenting based on one metric, you could use multiple metrics; this is known as micro-segmenting. For example, you could look at male users aged between 20-40 who frequently invest in tech.
By understanding users more granularly, you can ensure your site caters to them. Just remember, you’ll need the necessary knowledge to carry out tasks such as micro-segmentation effectively. Having an employee with certification will help. There are many certification options available. One example is Databricks’ data engineer certification.
#3 – Improve user experiences with audience reports
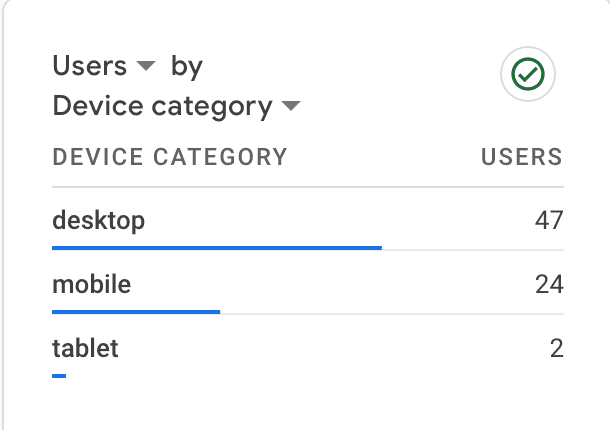
Image created by author
How are people accessing your site? On the face of it, this might seem like a basic question. But if you want to provide the best user experience, you need an answer.
Fifteen years ago, very little focus was placed on mobile users. In recent years, however, this has all changed. A recent survey showed that over 60% of internet users are now on mobile. If you want your website to rank highly in the SERP ranking, you need to cater to these users.
Using GA, you can find out exactly how many of your users are on mobile or tablet. But perhaps more importantly, you can find out exactly what devices they are using. From ‘Audience reports’ you can gain a list of devices. Using this information, you can make sure your website runs smoothly across multiple devices.
Let’s imagine that you’re looking at bounce rates on your site. Using segmentation, you might find that users on Android devices have a higher bounce rate. This suggests that these users are having a poor user experience.
Consider the steps that you can take to make improvements. Why not access your site from different devices yourself, and see how it performs?
#4 – Boost SERP performance using SEO metrics
Search Engine Optimization (SEO) is key for any online business. Far too many stumble blindly when it comes to SEO. They make improvements here and there and hope for the best. To be effective, SEO needs a roadmap. You need a way of measuring your success and knowing which areas to focus on.
GA provides users with several SEO metrics to help measure their success. Take time, and build these into your wider SEO strategy. Using mind map software can help you to structure your plan.
Some examples of GA’s SEO metrics include:
- Bounce rate: A key factor in SERP ranking is user experience. The bounce rate tells you the percentage of users that left after viewing only one page. A high bounce rate indicates a poor user experience.
- Site speed: Slowly loading websites aren’t looked upon favorably by the Google Algorithm. Keeping an eye on the site speed metric is essential for success.
- Organic conversions: When people enter your site organically (through Google Search) are they making valuable actions? If your SEO strategy is successful, the number of organic conversions should increase.
- Dwell time: This is the amount of time a user spends on a page. Your SEO tactics should focus on creating valuable content for users. If dwell time is low, you need to rethink your approach.
#5 – Create conversion events to measure success
There are several important interactions you’ll want your users to take. For example, you’ll probably want to ensure that people are signing up for your mailing list. However, creating a sign-up page and hoping for the best won’t get you very far. Similarly, you don’t want to be constantly monitoring your mailing list.
Web data analytics allows you to monitor key events from a centralized space. What’s more, with GA, you can create conversions events. These can monitor any interaction that you’d like. Consider the actions that are most important to you and create conversion events to match them.
If a particular conversion event isn’t being triggered, you can investigate further. You may find that a page has a low dwell time, or is inaccessible to mobile users.
Web data analytics is essential
There’s no avoiding the fact; if you run a website online, you need web data analytics. If you haven’t already, sign up for Google Analytics (it’s free!). If GA isn’t for you, there are lots of alternatives to consider.
Be sure to also bear in mind additional tools that you might need to support website development. For example, you can manage infrastructure with Platfrom.sh. This can help to ensure the future scalability of your website.
Once set up with your chosen analytics tool, consider the tips mentioned here. Use these as a guideline as you make your first website improvements. Remember, however, that there are many, many more ways that analytics can help you. Luckily, there’s no shortage of additional materials.
Don’t get left behind by your competitors. Start making the most of web data analytics.