
In this 5 Minute Analysis we’ll focus on exploring the collection of Kaggle datasets data in real-time, reorganizing it, and filtering the data to find popular datasets with many downloads but very few kernels.
Dataset: Complete Kaggle Datasets Collection
This blog post explores and analyzes the data using PivotBillions, available freely on docker.
Goals
- Load the data to Pivot Billions and explore its structure.
- Pivot the data to reorganize it by title, description, kernel use, and number of downloads.
- Use Pivot Billions’ built-in features to filter the data by kernel use and downloads and find the datasets that don’t have much code development on Kaggle but have a high level of interest.
Steps
Load the Data and View its Structure
- Download the dataset from Kaggle.
- Unzip your downloaded data.
- Access the Pivot Billions URL for your machine.
- Click the Plus (+) icon on the top right hand side of the window.
- Select Drag & Drop.
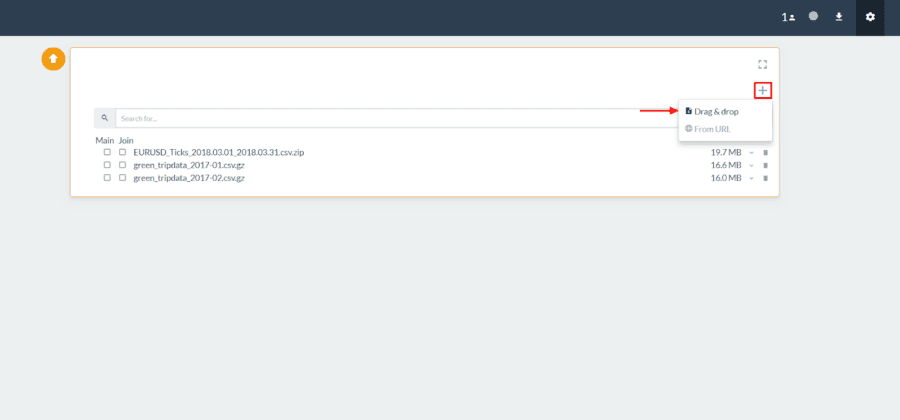
- Drag your downloaded “kaggle_datasets.csv” file to the Drag & Drop box in Pivot Billions.
- Click the dropdown arrow
 to the right of the file in Pivot Billions to view the schema of the data and see a sample.
 - Then select the left checkbox next to the file and click Preview at the bottom of the screen.
 to the right of the file in Pivot Billions to view the schema of the data and see a sample.
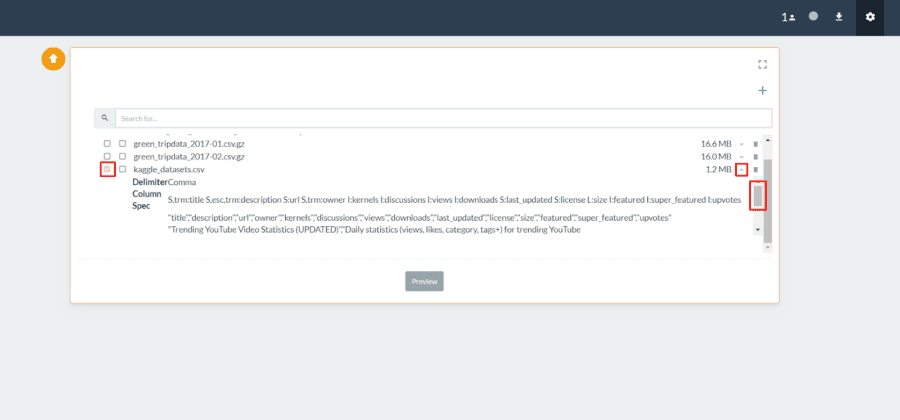
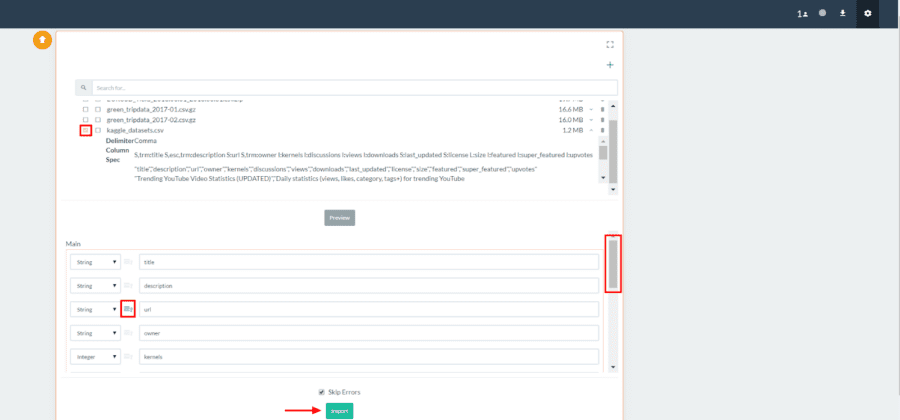
You can now see the columns and types of the dataset and modify them as you see fit. You can also view or change which column or columns are set as primary keys. When you are done viewing or modifying the data structure to be imported, click Import.
Reorganize the Data to Explore Kernel to Download Discrepancies.
Now that we can view and explore the data, let’s reorganize our data to dive into datasets with many more downloads compared to kernel use.
- Click the Pivot icon in the the top right of your data table.
- Click the Plus (+) icon under Dimensions and select the “title” column.
- Click the Plus (+) icon again and select the “description” column.
- Click the Plus (+) icon again and select the “kernels” column.
- Click the Plus (+) icon under Values and select the “downloads” column.
- Click View to pivot your data.
 in the the top right of your data table.
Pivot Billions now quickly reorganizes your data by dataset title, description, and number of kernels. It also provides counts, sums, and statistics on the downloads of each dataset. You can sort by a column or filter the data. Here we’ll add some filters to restrict the data to just datasets with many downloads but only a few kernels.
- In the top-left of the pivot widget, click the Plus (+) button.
- Select “kernels” and “Less Than”.
- Enter “5” and press enter.
- Click the Plus (+) button again.
- Select “Sum” and “Greater Than”.
- Enter “100” and press enter.
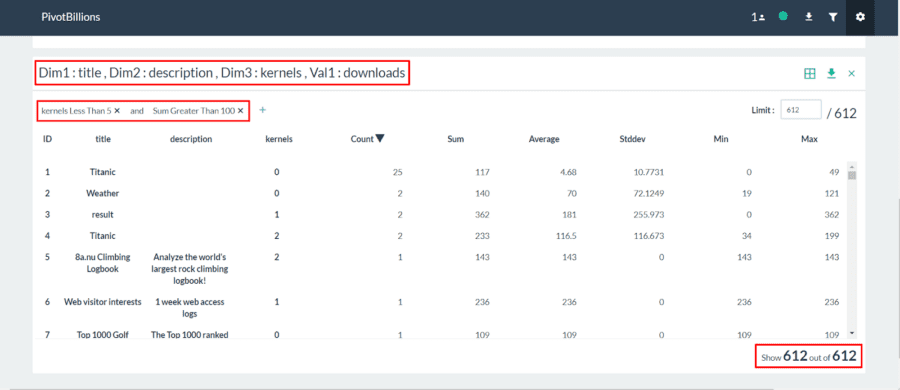
You can see the filters immediately applied and the data reduced from 7,666 unique combinations to just the 612 unique combinations matching our filters.
We’ll now interactively view the data.
- Click the Switch View Type icon in the top right of the pivot widget and select Pivot View.
- Drag the title box to below the drop down selection box.
- Drag the description box to below the drop down selection box.
- Drag the kernels box to the right of the drop down selection box as shown below.
- Click the lower drop down selection box and change “Count” to “Summation”.
- Click the leftmost arrow twice so that it is pointing up to sort the data.
 icon in the top right of the pivot widget and select Pivot View.
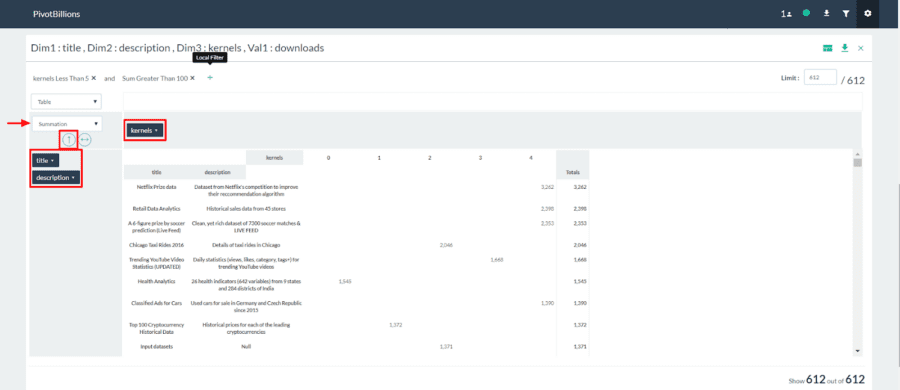
We can immediately see a variety of very popular datasets that have been downloaded thousands of times yet have very few or no kernels developed. Many of these are likely underutilized datasets that aren’t easily understood using existing tools and could benefit from additional exploration and analysis incorporating new tools such as PivotBillions.