
In this 5 Minute Analysis we’ll preprocess, map, and explore complicated sales data for liquor stores in Iowa. Then we’ll extract the relevant latitude and longitude from a problematic column of the data and discover the city with the most sales. Next we’ll filter the data to that city and prepare the data for easy loading into Business Analysis tools such as Tableau and PowerBI. Finally we’ll use our extracted location data to visualize sales within the selected city.
Dataset: Iowa Liquor Sales
This blog post explores and analyzes the data using Pivot Billions, available freely on docker.
* I recommend allocating 7.5 GB to your docker container for this analysis since this dataset is over 12 Million rows.
Steps
Add the Data and View its Structure
- Download the dataset from Kaggle.
- Access the Pivot Billions URL for your machine.
- Click the Plus (+) icon on the bottom left hand side of the window.
- Select Drag & Drop.
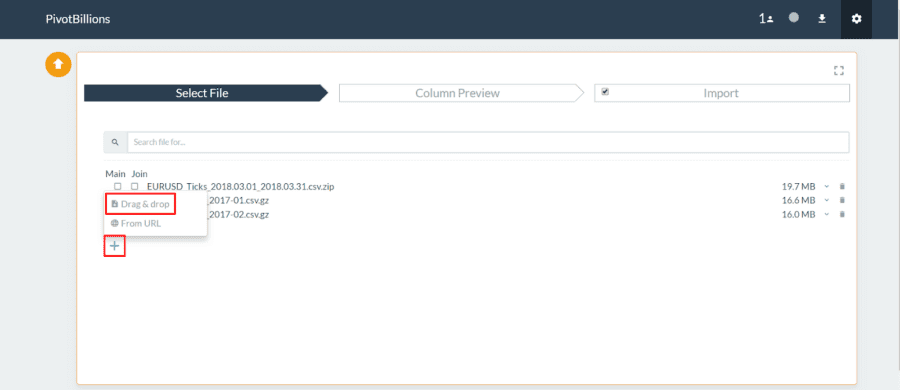
- Drag your downloaded “Iowa_Liquor_Sales.csv.zip” file to the Drag & Drop box in Pivot Billions.
- Click the dropdown arrow
 to the right of that file in Pivot Billions to view the schema of the data and see a sample.
 - Then click Column Preview at the top of the screen.
 to the right of that file in Pivot Billions to view the schema of the data and see a sample.
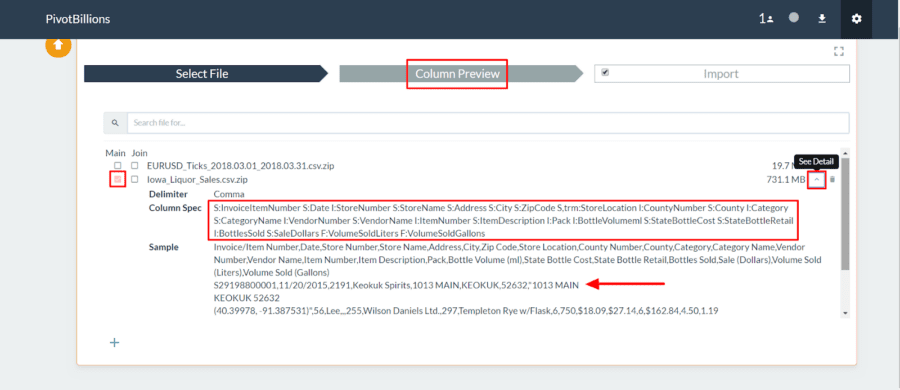
Perform ETL Operations on and Load the Data
The Column Preview tab allows you to see the columns and types of each dataset and modify them as you see fit. You can also view or change which column or columns are set as primary keys and determine how datasets should be joined. When you are done viewing or modifying the data structure, you can import and load the data.
For our dataset, we’ll create two new columns from the StoreLocation column: Latitude and Longitude.
- Click the Plus (+) icon on the bottom left hand side of the window to add a new ETL box.
- Click the icon to the left of the ETL box to switch to Advanced ETL mode.
- Enter latitude into the Column Name box.
- Enter -eval s:latitude ‘””‘ -eval – ‘RxMap(StoreLocation,”^.*(\(.*\),\(.*\)).*$”,latitude,”%%1%%”)’ into the Ess Syntax box.
- Click the Plus (+) icon again to create a second ETL box.
- Click the icon to the left of the new ETL box to switch to Advanced ETL mode.
- Enter longitude into the Column Name box.
- Enter -eval s:longitude ‘””‘ -eval – ‘RxMap(StoreLocation,”^.*(\(.*\),\(.*\)).*$”,longitude,”%%2%%”)’ into the Ess Syntax box.
- Confirm the output is what is expected by clicking Check.
- Click Import at the top of the screen.
 icon to the left of the ETL box to switch to Advanced ETL mode.
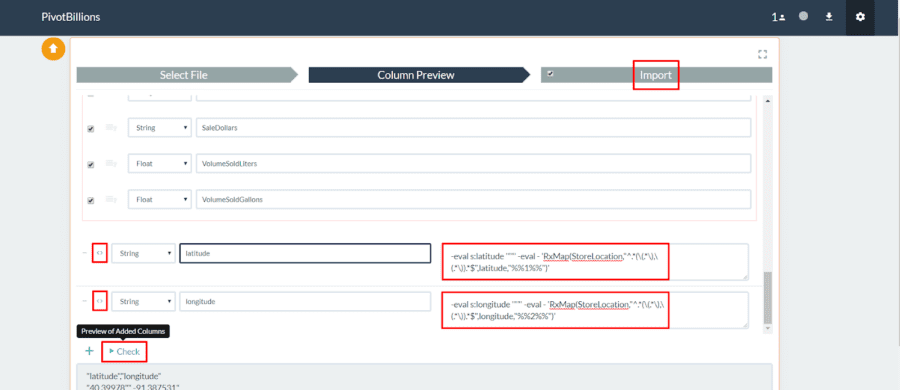
Explore, Filter, and Download the Wrangled Data.
We now have access to all 12,591,077 rows of the Iowa Liquor Sales data. This contains the original data in an easy tabular format along with the two new latitude and longitude features we’ve created.
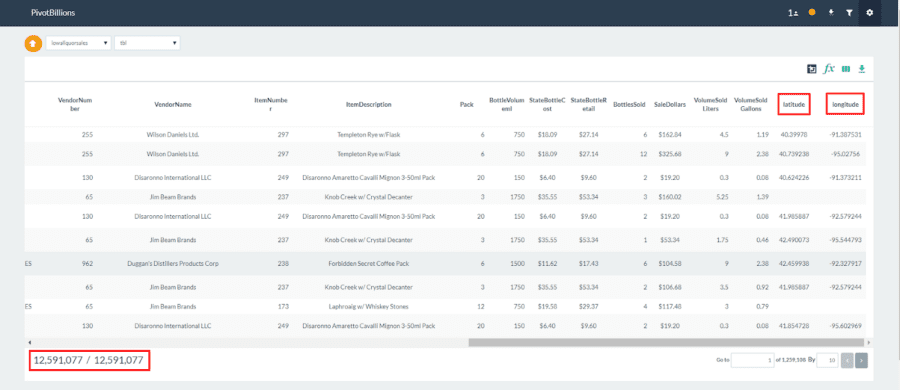
By hovering over each column name you can sort the data by that column, view that column’s distribution over all of the data, filter by the data in that column, or rename that column. For example, we can view the distribution of sales by city for our data by clicking on the second-from-the-left icon (distribution) in  for the City column.
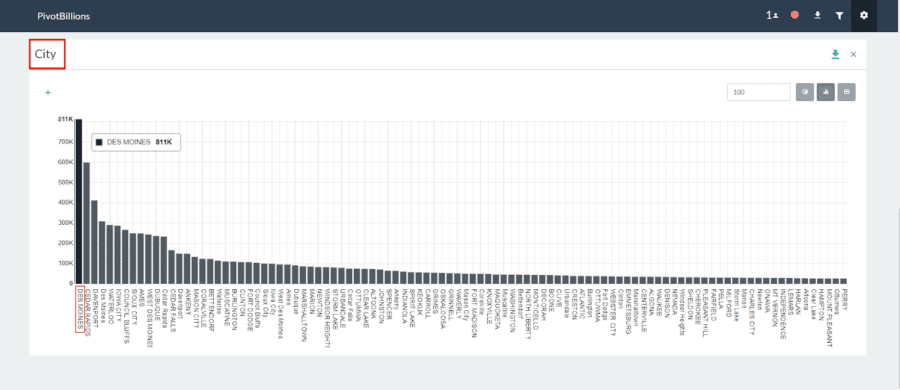
As expected, the capital of Iowa (Des Moines) with the highest population of any city in the state has the highest total number of sales.
Now, for our analysis we’ll filter all of the data to only include data for the city of Des Moines.
- Click on the second-from-the-right icon (filter) in for the City column.
- Select Equals from the dropdown and then enter “Des Moines” and press enter. All of our data is immediately filtered to just Des Moines data.
 for the City column.
The data is almost ready for Tableau or another business intelligence tool but the StoreLocation column is troublesome and prevents Tableau from reading the data. So we’ll go ahead and download the data without this column.
- Click the icon on the top right.
- Unselect the box next to StoreLocation to remove that column from your selected data.
 icon on the top right.
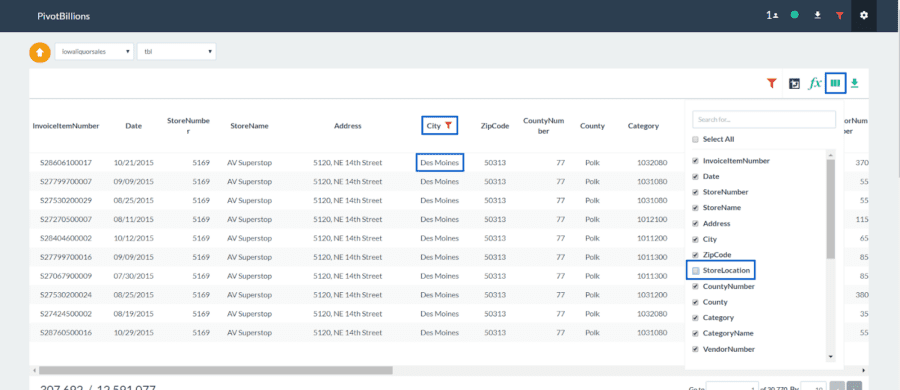
- Now click the icon on the top right.
- Enter “DesMoinesSales” for the file name and then click Selected Columns.
- When the file is ready for download click the at the bottom of the screen as seen below.
 icon on the top right.
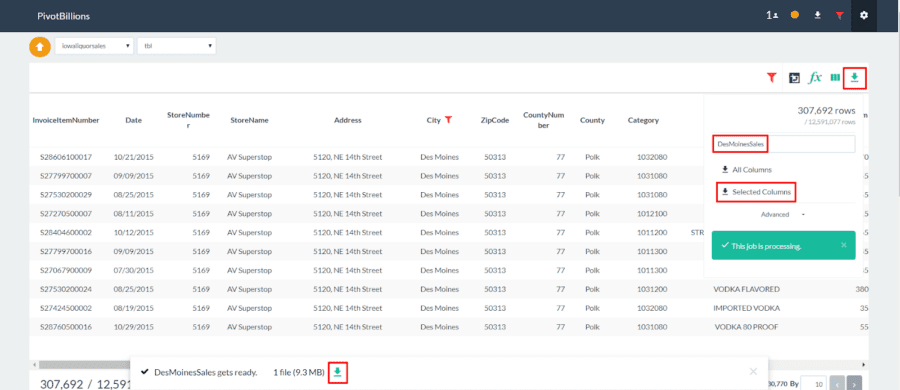
Import and Graph the Data in Tableau
We can now easily import this data into Tableau and use its powerful visualizations to dive into Des Moines liquor sales by location.
- Unzip the “DesMoinesSales.csv.zip” file we just downloaded from PivotBillions.
- Open Tableau and click Text under Connect.
- Navigate to the folder where the “DesMoinesSales.csv” file is located and Open it.
- Then click on Sheet1.
- Right click Latitude under Measures and select Convert to Discrete and then Convert to Dimension.
- Repeat this for Longitude.
- Drag Longitude to Columns and Drag Latitude to Rows as seen below.
- Drag Sale Dollars to Size and drag whatever features you want to Detail.
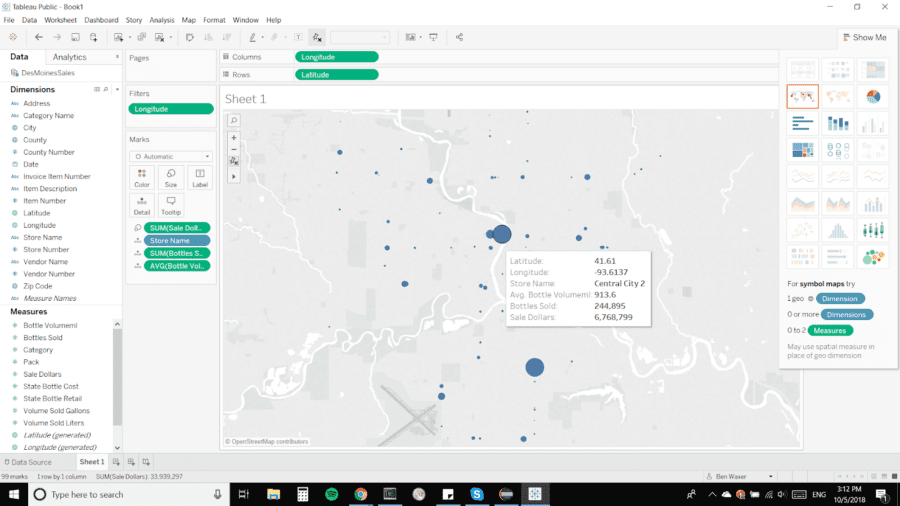
It is clear from this SymbolMap plot that the sales for Des Moines are highest near the city center. However, it is also clear that there are many high volume locations throughout the city. We can now visualize the data however we see fit in Tableau. We could also easily remove our city filter from PivotBillions and load the whole preprocessed data into Tableau, or change our filter(s) to select a different subset or arrangement of the data.
To view and interact with this visualization or download the workbook to Tableau, see my Iowa Liquor Sales Workbook on Tableau Public.