

Those that encounter my blogs might notice two distinct types: 1) blogs that I formally prepare almost like an essay; and 2) those that are “unplugged” or informally prepared rather like a personal journal entry. The mystique of writing something where I don’t exactly know the ending or even the main points hasn’t completely waned although I appreciate that this style has some drawbacks. This morning, I mark the 1-year anniversary of the COVID-19 stock market crash with an unplugged blog entry.
One characteristic of an unplugged piece is that I tend to inject fairly random thoughts. For example, having blogged on Data Science Central for many years, I got over the habit of using “data” as a plural almost immediately. I almost always use data to mean a body of data. I never refer to a datum or piece of data. But even if the body of data contains only one piece of data, for me the number never changes since it is a body of data and therefore singular. Consequently, I ask, “What does (not do) the data from last year show us?” And I say, “The data shows (not show) us this . . .”
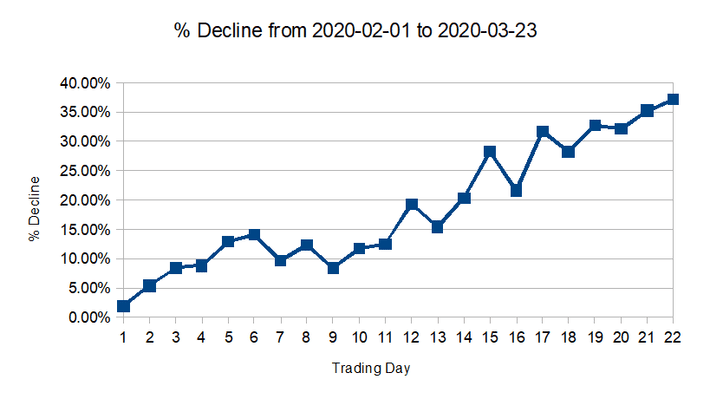
Generally speaking because the Dow Jones Industrial Average has been tracked for decades, I tend to use it when checking for major changes in the stock market. The chart above shows that the Dow declined about 37 percent from February 12, 2020 before bottoming out. It was definitely a major correction. It occurred in such a controlled manner, during the presidential election I think most people could only recall the stupendous recovery that followed. But the decline certainly happened from a high point as I will demonstrate in a moment.
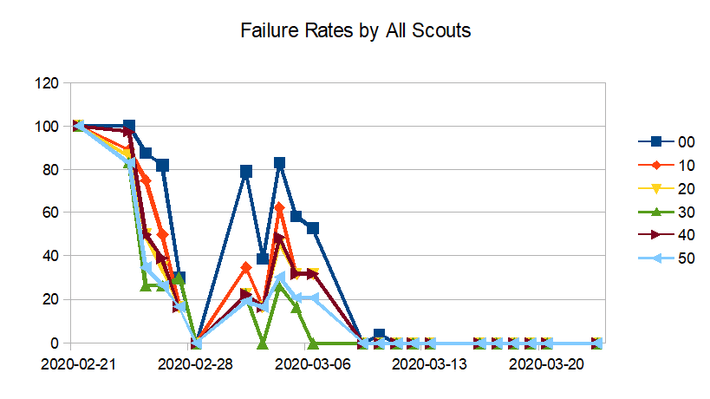
I have been using an algorithmic environment that usually shows a failure rate of about 100 percent just before a major correction. These algorithms are “risk averse” meaning that they dislike market activity that might be regarded as risky. If I had to describe how they behave in an operational sense, I would say that they buy low and sell high (BLASH). What might cause such astute algorithms to fail? Well, failure is relative. Failure means performing below market, which operationally equates to a buy-and-hold strategy (BAH).
Described a bit differently, BAH investors seem psychologically impervious to intraday dips whereas BLASH investors might run way at a certain point. Of these two types, I suggest that BAH investors create stock market bubbles. As fate would have it, the COVID-19 lockdowns occurred during a time when the Dow was contributing to a 100 percent failure rate for the BLASH. As the chart above shows, in a so-called “correction,” the BLASH-type algorithms tend to become completely victorious: the failure rate changes from 100 percent to 0 percent where it remains for quite some time. How long exactly does it remain there?
The expression “catch a falling knife” is not something to take lightly. Jumping in to catch a knife can cause serious injury. There is a macro- and micro- way of looking at the situation. Using a kind of micro perspective, if the failure rate hangs around 0 percent for some time, I can refer to the individual algorithms and just check if they are currently invested. (After all, none of them are failing. Taking this literally, none of them should be wrong. I wish life were this simple.) The macro approach requires a different kind of chart.
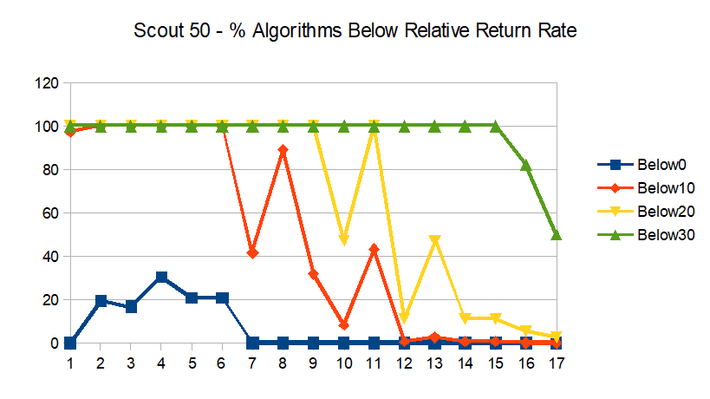
It just occurred to me that I never explained what a “scout” is. A scout in relation to these charts represents a sampling adjustment: for scout 50, the start of the sampling period is 50 trading days after scout 00. There are many good reasons to scout around – one being to check for consistency. Another reason is that the past data might be suppressing emergent but important developments. At scout 00, 100 percent of the algorithms started below market. At scout 50 as market activity continues, we see that at some point, 0 percent of the algorithms are less than market (Below0). At the bottom, scout 50, a majority of algorithms are even above Below30. Say what? Well, 100 percent were Below30 at the beginning. I am not saying that 0 percent are Below30. But more than 50 percent are. Say what?
The COVID-19 crash I would say is one of the most troubling crashes I have studied to date given its lack of warning. I found no signs of a crash coming until the market was down more than 5.38 percent from the recent high, which I consider an expensive signal. By the time an investor could respond to the signal the following day, the loss relative the high was 8.36 percent. Perhaps the only way to avoid getting caught would have been to remain on the sidelines once the BLASH start hitting 100 percent failure rates. Simulations suggest that my algorithms don’t actually “sell at a high” specifically but rather begin to fail in BAH scenarios – or even more specific than this, whenever the closing price seems relatively indifferent to the intraday activity.
In the history of stock-market crashes, the COVID-19 crash of 2020 might not be recognized as an actual crash in light of the enormous gains that soon followed. But a 37 percent dip in market value in a diversified basket of stocks is nothing to sneeze at. In terms of using an algorithm, the are a few problems that I need to mention: 1) if a person sells in response to an algorithm, the stock might recover before there is a buy signal; and 2) if a person buys in response to an algorithm, of course the stock might dip again or continue to give sell signals later. In short, it is great having the luxury to look back in time safely.