
Data science development is very different from software development, and getting the two to mesh is sometimes like trying to cobble together Tinker Toys with Lincoln Logs. One data science expert once described the differences as:
Software development is “Measure twice; cut once,” while Data Science is “Cut, cut, cut!”
The methodologies and processes that support successful software development do not work for data science projects according to one simple observation: software development knows, with 100% assurance, the expected outcomes, while data science – through data exploration and hypothesis testing, failing and learning – discoversthose outcomes.
First introduced in the blog “What’s The Difference Between BI Analyst and Data Scientist?”, the Data Science Engagement methodology in Figure 1 supports the rapid exploration, rapid testing, and continuous learning Data Science “Scientific Method[1]”.
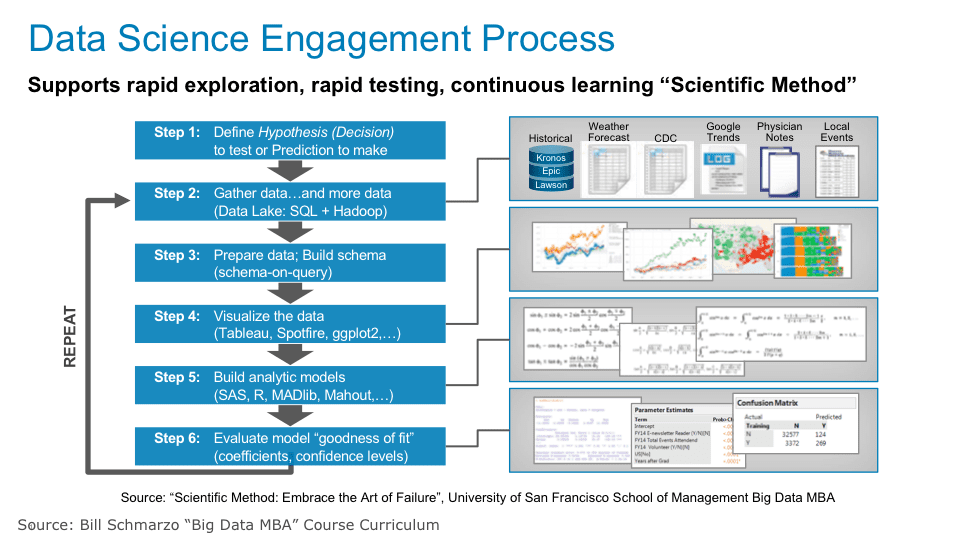
Figure 1: Data Science Development Methodology
As highlighted in Figure 1, the Data Science Development differs from Software Development in the following areas:
- Must have Data
- Collaborative Hypothesis Development Process
- Data Exploration and Discovery Curiosity
- Mastering the Art of Failure
- Understanding of When “Good Enough” is “Good Enough”
- Embrace a Continuously Learning/Retuning Process
Let’s review each of these in more detail.
1) Must Have Data…and Preferably BIG DATA!
Big Data is the fuel for data science, as the more granular, diverse and complete the data sets, the more accurate the Artificial Intelligence, Deep Learning and Machine Learning predictive models.
Gartner analyst Doug Laney coined the “3 V’s of Big Data” concept in a 2001. The 3 V’s (volume, variety and velocity) are the defining dimensions of big data where volume refers to the amount of data, variety refers to the number of types of data, and velocity refers to the speed of data processing. And the continued growth of big data grows unabated, courtesy of the advent of wearables (Apple Watch, FitBit), Internet of Things (sensors, connected devices), photos, images, video, audio and voice.
But it’s not the volume of data that is valuable; it’s the granularity of the data. The value in Big Data resides in the insights, behaviors, tendencies, inclinations, associations and relationships at the individual level, whether individual humans (student, patient, doctor, technician, engineer) or individual devices (turbine, compressor, chiller, pump, switch, motor). Whether human Analytic or Behavioral Models, or device Digital Twins, the monetization value and actionability of Big Data is found at the level of the individual entity.
2) Collaborative Hypothesis Development Process
Step 1of the Data Scientist Development Methodology (Figure 1) starts with the Data Scientist identifying the prediction or hypothesis that they want to test. This is a result of collaborating with the business stakeholders to understand the key sources of business differentiation and then brainstorming data and variables that might yield better predictors of performance.
The Data Science Development methodology requires significant collaboration with the business stakeholders throughout the development process to:
- Understand and quantify the sources of financial, operational and customer value creation (it’s an economics thing).
- Brainstorm the variables and metrics (data sources) that might yield better predictors of business and operational performance.
- Codify the rewards/benefits and the costs/risks associated with the hypothesis (including the risks and costs associated False Positives and False Negatives).
- Close collaboration with the Business Stakeholders to understand when “good enough” is actually “good enough.”
To facilitate the business stakeholder-data science collaboration, we have created the Hypothesis Development Canvas – a template that we will populate prior to executing a data science engagement to ensure that we thoroughly understand what we are trying to accomplish, the business value, how we are going to measure progress and success, what are the impediments and potential risks associated with the hypothesis (see Figure 2).
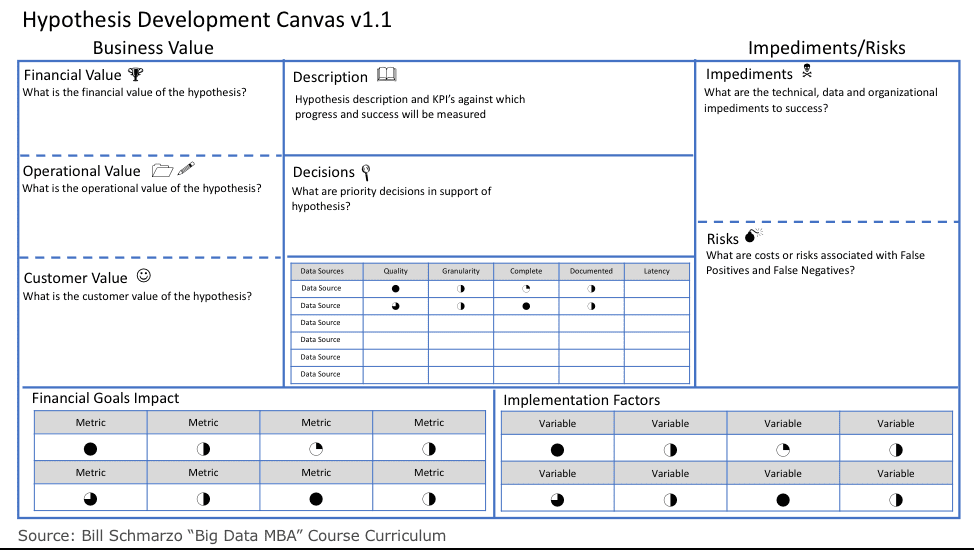
Figure 2: Hypothesis Development Canvas
The Hypotheses Development Canvas includes the following:
- Hypotheses Description and Objectives – what it is the organization is trying to predict and it’s associated goad (e.g., reduce unplanned operational downtime by X%, improve customer retention by X%, reduce obsolete and excessive inventory by X%, improve on-time delivery by X%).
- Hypothesis Business Value from the Financial, Customer and Operational perspectives; that is, what is the rough order Return on Investment (ROI) from successfully addressing the hypothesis.
- KPI’s against which to measure success and progress, and the exploration of the risks associated with potential 2ndand 3rdorder ramifications of KPI’s. See the blog “Unintended Consequences of the Wrong Measures” for more details on 2ndand 3rdorder ramifications of KPI’s.
- Decisions – the what, when, where, who, etc. – that needs to be made to support and drive actions and automation in support of the hypothesis’s business, customer and operational objectives.
- Potential data sources to explore including a brief description and why the business stakeholders feel that might be an appropriate data source to explore.
- Risks associated with False Positives and False Negatives (Type I and Type II Errors); the risks associated with those scenarios where the analytic model is wrong.
A Vision Workshop accelerates the collaboration between the business stakeholder and the data science team to identify the hypothesis requirements that underpin data science engagement success.
3) Data Exploration and Discovery Curiosity
The key to being a successful data scientist is similar to being a good detective – ask lots of questions, create lots of propositions, and do lots of exploration and investigation. Think a combination of Dick Tracy (action-biased), Sherlock Holmes (brilliant ideation) and Columbo (relentless exploration)! A good Data Scientist quickly learns that more than challenging the model, that the key to success is to be constantly challenging the assumptions that underpin the model.
Step 2of the Data Scientist Development Methodology (Figure 1) is where the data scientist gathers relevant and/or interesting data from a multitude of internal and external sources. The data lake is a great platform for this data gathering, aggregation and alignment process. The data scientist can grab any data they want, test it, ascertain its value given the hypothesis, and then decide whether to include that data in the predictive model or throw it away.
Step 3is where the data scientist defines and builds the schema necessary to address the hypothesis being tested. The data scientist can’t define the schema until they know the hypothesis that they are testing AND know what data sources (structured, semi-structured, unstructured, video, images) they are going to be using to build their analytic models.
Step 4of the Data Scientist Development Methodology leverages data visualization tools to explore the data and uncover potential correlations and outliers of interest buried within the data. The visual tools can help to identify correlations and associations buried in the data sets.
The role of data engineering (the under-appreciated member of the data science family) plays a crucial role in the data science engagement methodology. Data Engineering develops, constructs and maintains the large-scale data processing systems that collects data from variety of structured and unstructured data sources, stores data in a scale-out data lake and prepares the data in preparation for the data science data exploration and analytic modeling.
See the blog “What’s the Difference Between Data Integration and Data Engineering?” for more details on the vital role of the Data Engineer.
4) Mastering the Art of Failure
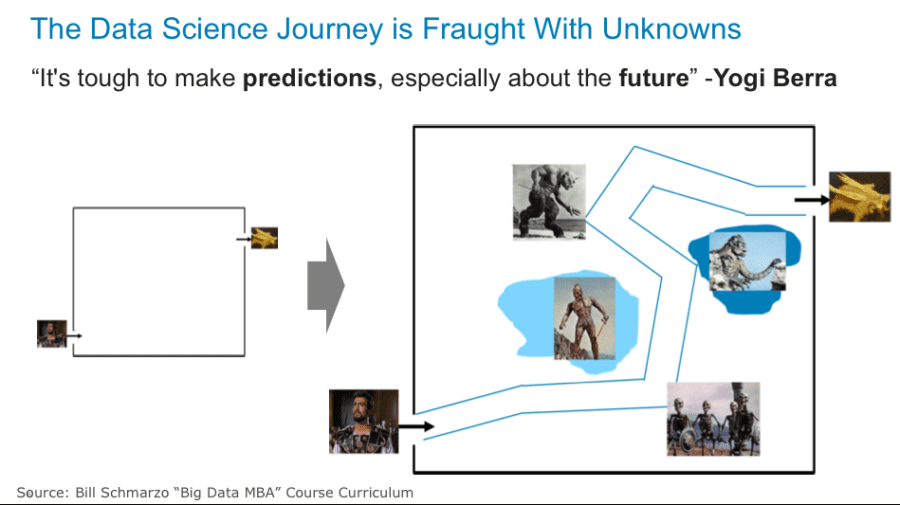
“It’s tough to make predictions, especially about the future.” – Yogi Berra
Because the exact variables and metrics (and their potential transformations and enrichments) are not known beforehand, the data science development process must embrace an approach that supports rapid testing, failing, learning, wash and repeat.
This attitude is reflected in the “Data Scientist Credo”: Data science is about identifying those variables and metrics that mightbe better predictors of performance; to codify relationships and patterns buried in the data in order to drive optimized actions and automation.
Step 5of the Data Scientist Development Methodology (Figure 1) is where the real data science work begins – where the data scientist uses tools like TensorFlow, Caffe2, H20, Keras or SparkML to build analytic models – to codify cause-and-effect. This is true science, baby!! The data scientist will explore different analytic techniques and algorithms (data mining, predictive analytics, supervised machine learning, unsupervised machine learning, neural networks, reinforcement machine learning, etc.) to try to create the most predictive models.
See the blog “Design Thinking: Future-proof Yourself from AI” for insights into how to leverage Design Thinking to learn how to embrace failure as a way to learn faster (see Figure 3).
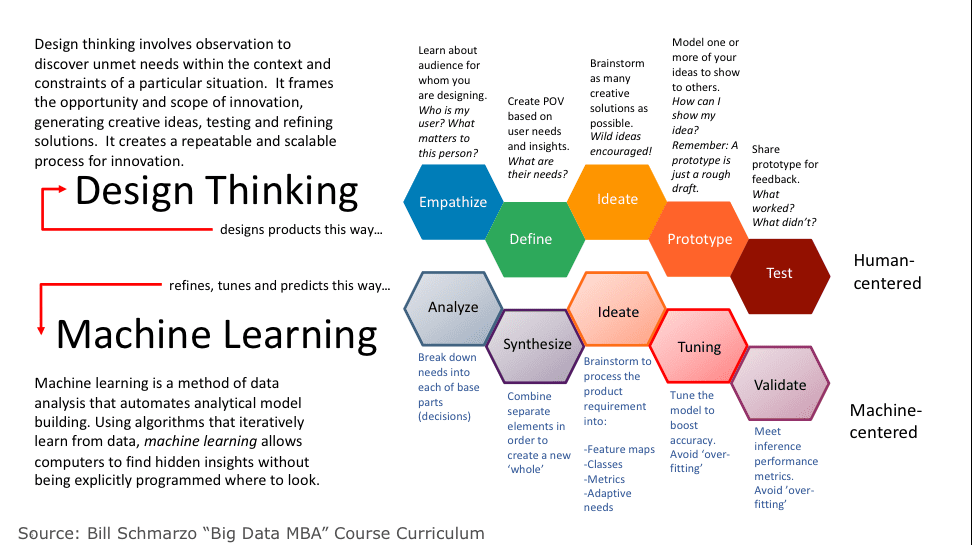
Figure 3: Mastering the Art of Exploration and Failure to Learn
5) Understanding of When “Good Enough” is “Good Enough
Maybe the most difficult aspect of data science development for software developers to understand is that the data science work is NEVER done because there is NEVER a point of 100% accuracy in the work. There is no clean point of closure for the data science work. In fact, analytic models decay over time and constantly need to be re-tuned due changing factors including behaviors and attitudes, demographics, weather patterns, world and local economics, metal fatigue, parts wear-and-tear, new technology developments, new data sources, etc.
Step 6in the data science process is where the data scientist will try to ascertain the model’s goodness of fit. The goodness of fit of a statistical model describes how well the model fits a set of observations. A number of different analytic techniques will be used to determine the goodness of fit including Kolmogorov–Smirnov test, Pearson’s chi-squared test, analysis of variance (ANOVA) and confusion (or error) matrix.
In order to determine if “good enough” is really “good enough”, one needs to invest the time to understand the costs associated False Positives and False Negatives (Type I and Type II Errors). The real challenge is determining whether the improvement in performance from the analytic model is “good enough.” The Confusion Matrix can help us make that determination.
See the blog “Using Confusion Matrices to Quantify the Cost of Being Wrong” for more insights into how to determine if Good enough is really good enough.
6) Embrace a Continuously Learning/Retuning Process
Because “Done is Never Done” in building effective predictable analytics, the on-going effectiveness of the analytic model must be regularly monitored and retuned/retrained. The world is constantly changing – economic conditions, demographics, technology innovations, the Cubs winning the World Series – that cause analytic models to go “stale”. Consequently there needs to be an on-going process to monitor analytic model effectiveness (which tends to decay over time) that leads to re-training and re-tuning the analytic models.
To support the on-going retuning/retraining of the analytic models, the Agile software development process must be integrated with Analytics development Module (see Figure 4).
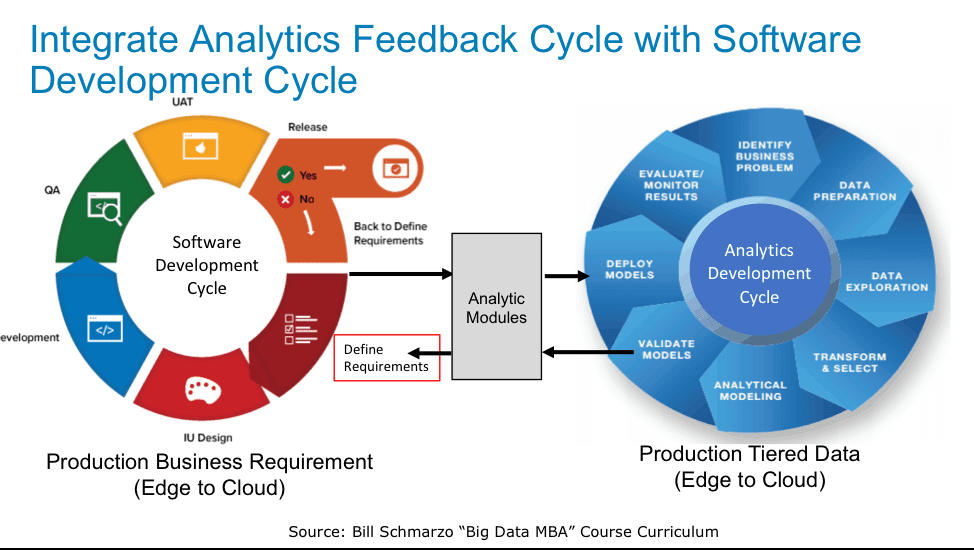
Figure 4: Integration of Analytics Retuning/Retraining with Agile Software Development
Summary
As Data Science moves into the mainstream of more organizations, both Product Development and Business Stakeholders need to understand that developing and operationalizing analytic models is different than developing and operationalizing software. While they share many of the same foundational capabilities (i.e., strong team alignment, clearly defined roles, mastering version control, regular communications rhythm), the data science development process has some unique requirements such as:
- Must have Data
- Collaborative Hypothesis Development Process
- Data Exploration and Discovery Curiosity
- Mastering the Art of Failure
- Understanding of When “Good Enough” is “Good Enough”
- Embrace a Continuously Learning/Retuning Process
The Data Science journey is fraught with unknowns. The known unknowns and unknown unknowns will only surface as the data science team moves along the journey. Like in the original movie “Jason and the Argonauts”, a good data science team must be prepared for whatever is thrown at them and adjust accordingly.
[1]Scientific Method is a procedure that has characterized natural science since the 17th century, consisting in systematic observation, measurement, and experiment, and the formulation, testing, and modification of hypotheses.