
Here is a guest blog by Ian White . 
Ian is an entrepreneurial product leader with 20 years experience spanning product management and business strategy at the intersection of data science, geospatial software, business intelligence and data acquisition. He has 10 years experience as startup founder and deep expertise geo/mapping, hyperlocal advertising, adtech, location-based services and data strategy in enterprise markets.
He can be followed at LinkedIn
I recently read an article (paywall) in the WSJ about Paul Allen’s Vulcan initiative to curb illegal fishing. It’s insightful and sheds light on Big Data techniques to address societal problems. After thinking on the story, it struck me that it could be used as a pedagogical tool to synthesize data science with domain knowledge. To me, this stands as the biggest limitation of what I refer to as ‘data science thinking’– letting technical skills drive the analysis, only later incorporating domain understanding.
This post somewhat reads like a case note from business school and the idea is to get data scientists, product managers and engineers talking earlier on in the process. I’ve laid it out to provide sufficient context around illegal fishing and how one might develop models to answer the key business question: can illegal fishing be combatted through novel approaches?
Next I reframe the issue by considering how additional data can help narrow uncertainty and offer a fresh perspective on the problem. Finally, I seek to reconcile a science-driven approach with one that incorporates more domain thinking. I suggest the reader starts with the article (if you don’t have a sub, try Googling the article title and you might find it):
Context
Why do we care about illegal fishing and poaching? It raises multiple economic and environmental concerns:
- Global seafood consumption per capita is at an all time high
- Illegal fishing contributes to rapid depletion of fish stock
- The UN’s Sustainable Development Goals make many nations treaty-bound
- Around 20% of the global seafood catch is illegal, which has disproportionate impact on coastal and less diversified economies
- Loss of jobs, taxable revenue, lax safety standards
- Violence and international disputes
Monitoring/policing/enforcing illegal fishing activities is difficult for a variety of reasons:
- No Registry: No unique vessel ownership IDs, leading to reflagging, renaming and other tricks to mask ship identity/activity (oddly the International Maritime Organization requires persistent IDs for other types seafaring vessels and is dragging its heels/anchor when it comes to fishing vessels)
- Size: The oceans are very large and there is no magic technology to track assets
- Rogue Actors: Non-signatories to illegal fishing regimes may harbor bad actors
- Compliance: Enforcement activities are underfunded, lack centralization, training, etc…
So, the overarching business issue is how to use data to best stop illegal fishing?
From the article:
Australian government scientists and Vulcan Inc., Mr. Allen’s private company, have developed a notification system that alerts authorities when suspected pirate vessels from West Africa arrive at ports on remote Pacific islands and South America.
The system, announced Sunday U.S. time, relies on anticollision transponders installed on nearly all oceangoing craft as a requirement under maritime law. These devices are detectable by satellite.
A statistical model helps identify vessels whose transponders have been intentionally shut off. Other data identifies fishing boats that are loitering in risk areas, such as near national maritime boundaries.
The article references “anticollision transponders,” which is the AIS used by maritime traffic to monitor/track all passenger ships and most cargo. Then there’s the bit about “statistical models” which I suppose is some flavor of machine learning to estimate when a transponder is turned off and a vessel is engaged in nefarious activity. How the “notification system alerts authorities when suspected pirate vessels…arrive at ports” if AIS is not active is unclear. Likely predicting movement in some way.
“Other data identifies fishing boats that are loitering in risk areas” is vague but maybe of immense value– does this mean other vessels visually identifying a target, a super large-scale sort of geofence, satellite imagery or something else?
Is this information sufficient to know where and when illegal fishing occurs? With what level of confidence? And how can we test our predictions? And what about ‘the last mile’ of relaying this to local authorities– does that happen in real time or is there a (say) week lag, further impeding enforcement? To proceed we need to better understand what we do not know, clarify what we do know and make some informed assumptions about how ocean fishing works.
What We Don’t Know
The answers below are clearly knowable, but arriving at the questions is the hard/interesting part. The relevant unknowns I identified are:
- How often is AIS relayed? Is it standard to have continuous broadcast or every x hours? Is the interval such that it will provide an area of uncertainty that is too vast to send maritime police to intercept?
- How extensive is AIS coverage? Just because an illegally fishing vessel turns off his transponder doesn’t mean anybody will know. Knowing which swaths of the earth are covered and how frequently they are refreshed by satellites is crucial info. To reiterate, the earth is a big place.
- Are AIS messages authentic/legitimate? AIS message types include a fair amount of metadata, some of which could be spoofed/incorrect in the hope of confusing enforcement regimes.
- Why would AIS be inactive? Was the transponder turned off because of a technical issue (loss of power), inadvertent (not knowing you unplugged the radio) or something else (pirates)? While a ‘dark ship’ may not indicate nefarious activity, a broadcasting ship does not imply full compliance.
- How Vulcan’s initiative fit with Leo’s World Fishing Watch or Pew’sProject Eyes On The Sea. From what I understand, all rely on AIS data but focus on different regions. I’d hope they collaborate on their different approaches but who knows.
Understanding Inputs
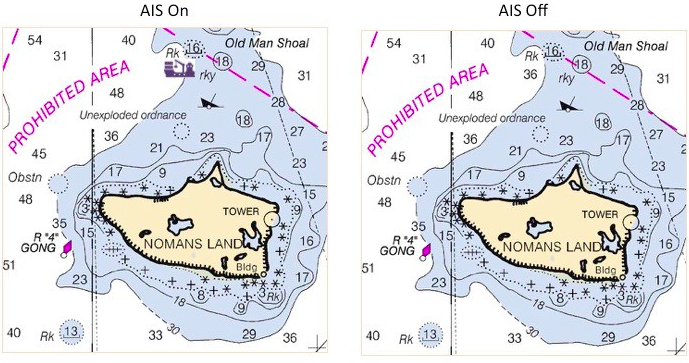
First, let’s look at (data) inputs. Below is a sample AIS message that has been formatted in JSON from source. The details don’t matter; essentially lng/lat is broadcast periodically with a bunch of attributes.
{ "day": 14, "fix_type": 1, "hour": 11, "id": 4, "minute": 33, "mmsi": 2320717, "month": 3, "position_accuracy": 0, "raim": false, "repeat_indicator": 3, "second": 30, "slot_offset": 2250, "slot_timeout": 0, "sync_state": 0, "transmission_ctl": 0, "x": -5.782454967498779, "y": 57.842193603515625, "year": 2012 }I imagine looking at AIS data on a screen is what one would expect: you’ll see a blip/ship of whatever icon you choose, with vectors displaying bearing and speed. When the transponder is turned off, the blip/ship disappears. This graphic shows this (obvious) concept, but it illustrates a limitation of visualization/user interface– capturing temporal changes can be much more difficult if the user is not technical.
Now it’s time to think like somebody in the ocean fishing business. Why would you (willfully) turn off your transponder? What could induce the transponder to stop broadcasting without human intervention? How about unwillingly turning off the transponder?
Thinking about feature engineering, we can begin to get a sense of what patterns of activity might be indications of fishing– maybe a reduction in speed and/or irregular course changes? Of course there might be shallow/dangerous areas that require slower speeds, but we also have to consider geographic target areas, ie, where the fish are. This could also play into weather.
Does illegal fishing happen with multiple ships? Maybe a large trawler rendezvous with smaller fishing vessels to transfer to a larger cargo hold? Now we also need to understand interactions of multiple ships in proximity considering transponder status, movement and location. It is helpful to think of activities performed by vessels that might be indicative of illegal behavior.
So far we have developed a fairly complex model, and we have more work to do! There are multiple factors to consider:
- AIS status
- Vessel movement patterns
- Geographic location
- Ships in proximity
- Weather/environmental conditions
This gets even more complicated when thinking about probabilities as we lack a robust ground truth– an indisputable source to help train our model. Without it we will have models with an unknown level of confidence.
So after all this (and a lot of technical work), we may not have enough varied data to meaningfully impact illegal fishing. Sigh. However, there still might be value in a rule-based system that encodes domain knowledge as that will help all future parties (it could also create adverse behavior to game the system, as described above).
From AIS data alone our analysis would require boiling the ocean to arrive at a manageable solution set that would still be challenging, at best, to test. The good news is is this was done in a relatively short timeframe using one brain.
But Wait, There’s More Data Out There
Enter a second independent data source that could help increase our confidence identifying a bad actor. We’ll use some flavor of remote sensing which permits us to observe ship location. It is unclear if we can track ships with imagery alone (see below). Cloud cover and other environmental events might limit what we can infer or see. As with AIS, the important questions to ask about this data type:
- Revisit Rate: are there enough satellite passes to track ships?
- Resolution: Can a human or machine identify the entity or is the picture too coarse?
- Sensor type: A bit technical, but are optics used or another instrument? This can help when environmental conditions are not favorable (SAR, for example, doesn’t see clouds).
We’ve already defined a set of rule-based activities that indicate illegal fishing behaviors. The maritime industry would be a great source of knowledge and some common-sense ideas could also be considered.
Now let’s revisit our conceptual model using both data types– ship broadcast AIS and remote-sensed imagery. The beauty of this approach is that the sources are not correlated, meaning a change in one does not impact the other. With this independence of measurement, we can use one source to validate the other. For this example, what if every time an AIS transponder went dark we could light up the target vessel using imagery, allowing us to track it using a different data source?
The convergence and interplay of these two data sources are what allow us to derive signal— confidence with the ability to act. The approach is well-used in quant hedge funds but applicability to non-financial markets is vast.
To get to this point we sought to make explicit what we didn’t know and made (we hope) reasonable assumptions. By walking through the analysis it became clear that uncertainty was reduced by an order of magnitude when introducing the second data source.
Conclusion
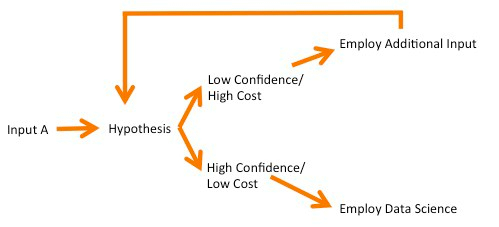
Like many things, this may seem obvious, but hopefully only in hindsight. I wrote this case as a way to explain how domain-specific thinking can bolster data science. It is an emergent skill dominant in hedge funds with the rise of the quantalist . It’s not a poke at data scientists, but rather a gap in how they can best collaborate with product management and business strategy. Simply put, don’t spend time on high cost activities until it makes sense to do so, as represented below. This chart is a sort of conceptual Bayesian inference at its most simplistic.
Abstracting this specific example, I am interested in better understanding statistical theory and applying it to real world/actionable opportunities. This is written from a guy who doesn’t know how to install an R package, so be under no illusion that I have mysterious training. It’s a matter of deconstructing questions until they are manageable, then leveraging unique insight. That alone can help increase (technical and emotional) confidence while efficiently using resources. The basic approach is one encapsulated in superforecasting.