
Over the last few years, Excel has been redesigned from the ground up. Currently, Microsoft is making the new Excel core-features available to every user, regardless of your Office 365 license. Thanks to the Microsoft naming conventions, it is easy to confuse the new features with existing ones. That being said, Power Query and Power Pivot are not the same things as Pivot Tables, which you have likely been using for years.
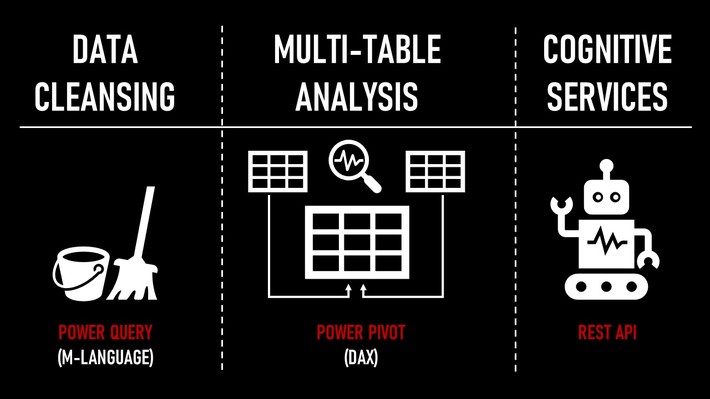
Power Query (M-Language)
Data preparation is very time-consuming. Power Query allows you to cleanse large amounts of data and make them usable within Excel: for example, a large CSV log file with lots of missing values, weird formats, and errors. Power Query is UI based, it’s easy to learn, and if you want to go the extra mile, you can learn its M-Language, which enables you to write custom scripts to automate data cleansing.
Power Pivot (DAX)
With Power Pivot, you can structure multiple tables into a star schema, with lookup tables and data tables. DAX (Data Analysis Expression) is a language that enables you to analyze data across your entire model. The learning curve is a bit steep, as you need to understand some important foundational concepts before you start using it. However, it’s a good choice if you work with large and complex datasets.
Cognitive Services
If you are a Citizen Data Scientist, and you want to consume machine learning and deep learning capabilities without building and training models yourself, Cognitive Services comes to your rescue. It’s a collection of (cognitive) vision, knowledge, language, search, and speech services, which can be consumed from within Excel via a REST API service. You can, for example, load customer reviews into Cognitive Services, perform a sentiment analysis and load the results back into Excel.
My take on the new Excel core-features
It’s a double-edged sword. On the one hand, Excel is being ramped up for an AI and the big-data-driven world we live in. On the other hand, though, Excel is becoming even harder to use for non-experts. In addition to its two established languages, the regular Excel function language (which has no name) and VBA, you now have to familiarize yourself with two new languages: M-Language and DAX.
What’s the alternative?
Realistically speaking, there is no alternative to Excel in the business world. Embrace the new Excel core-features, but don’t commit to them 100%. Consider using Python on Jupyter Notebooks in parallel, along with SQL, especially if you have a diverse team with non-technical staff, BI analysts, and data scientists who all need to work jointly on data.
After all, programming (especially Python) is not as hard to learn as most business people fear. If you can handle Excel, you will do well with Python. Just give yourself and your team time to learn. You will benefit greatly from Python libraries such as Pandas, Matplotlib, Sci-Kit, and TensorFlow.
I work in the field of Data & Technology Literacy. Please leave a comment, shoot me an email at [email protected] or reach out to me on LinkedIn.