
Visualization has become a key application of data science in the telecommunications industry.
Specifically, telecommunication analysis is highly dependent on the use of geospatial data. This is because telecommunication networks in themselves are geographically dispersed, and analysis of such dispersions can yield valuable insights regarding network structures, consumer demand and availability.
Data
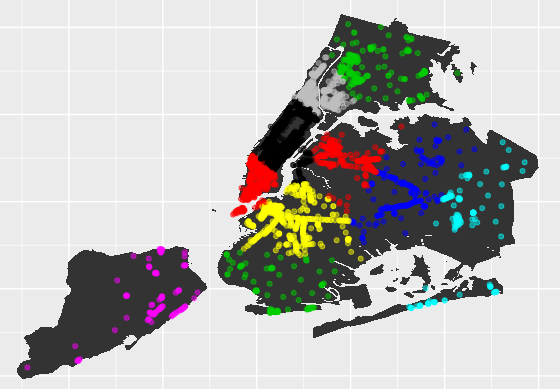
To illustrate this point, a k-means clustering algorithm is used to analyse geographical data for free public WiFi in New York City. The dataset is available from NYC Open Data.
Specifically, the k-means clustering algorithm is used to form clusters of WiFi usage based on latitude and longitude data associated with specific providers.
From the dataset itself, the latitude and longitude data is extracted using R.
Read full article here.