
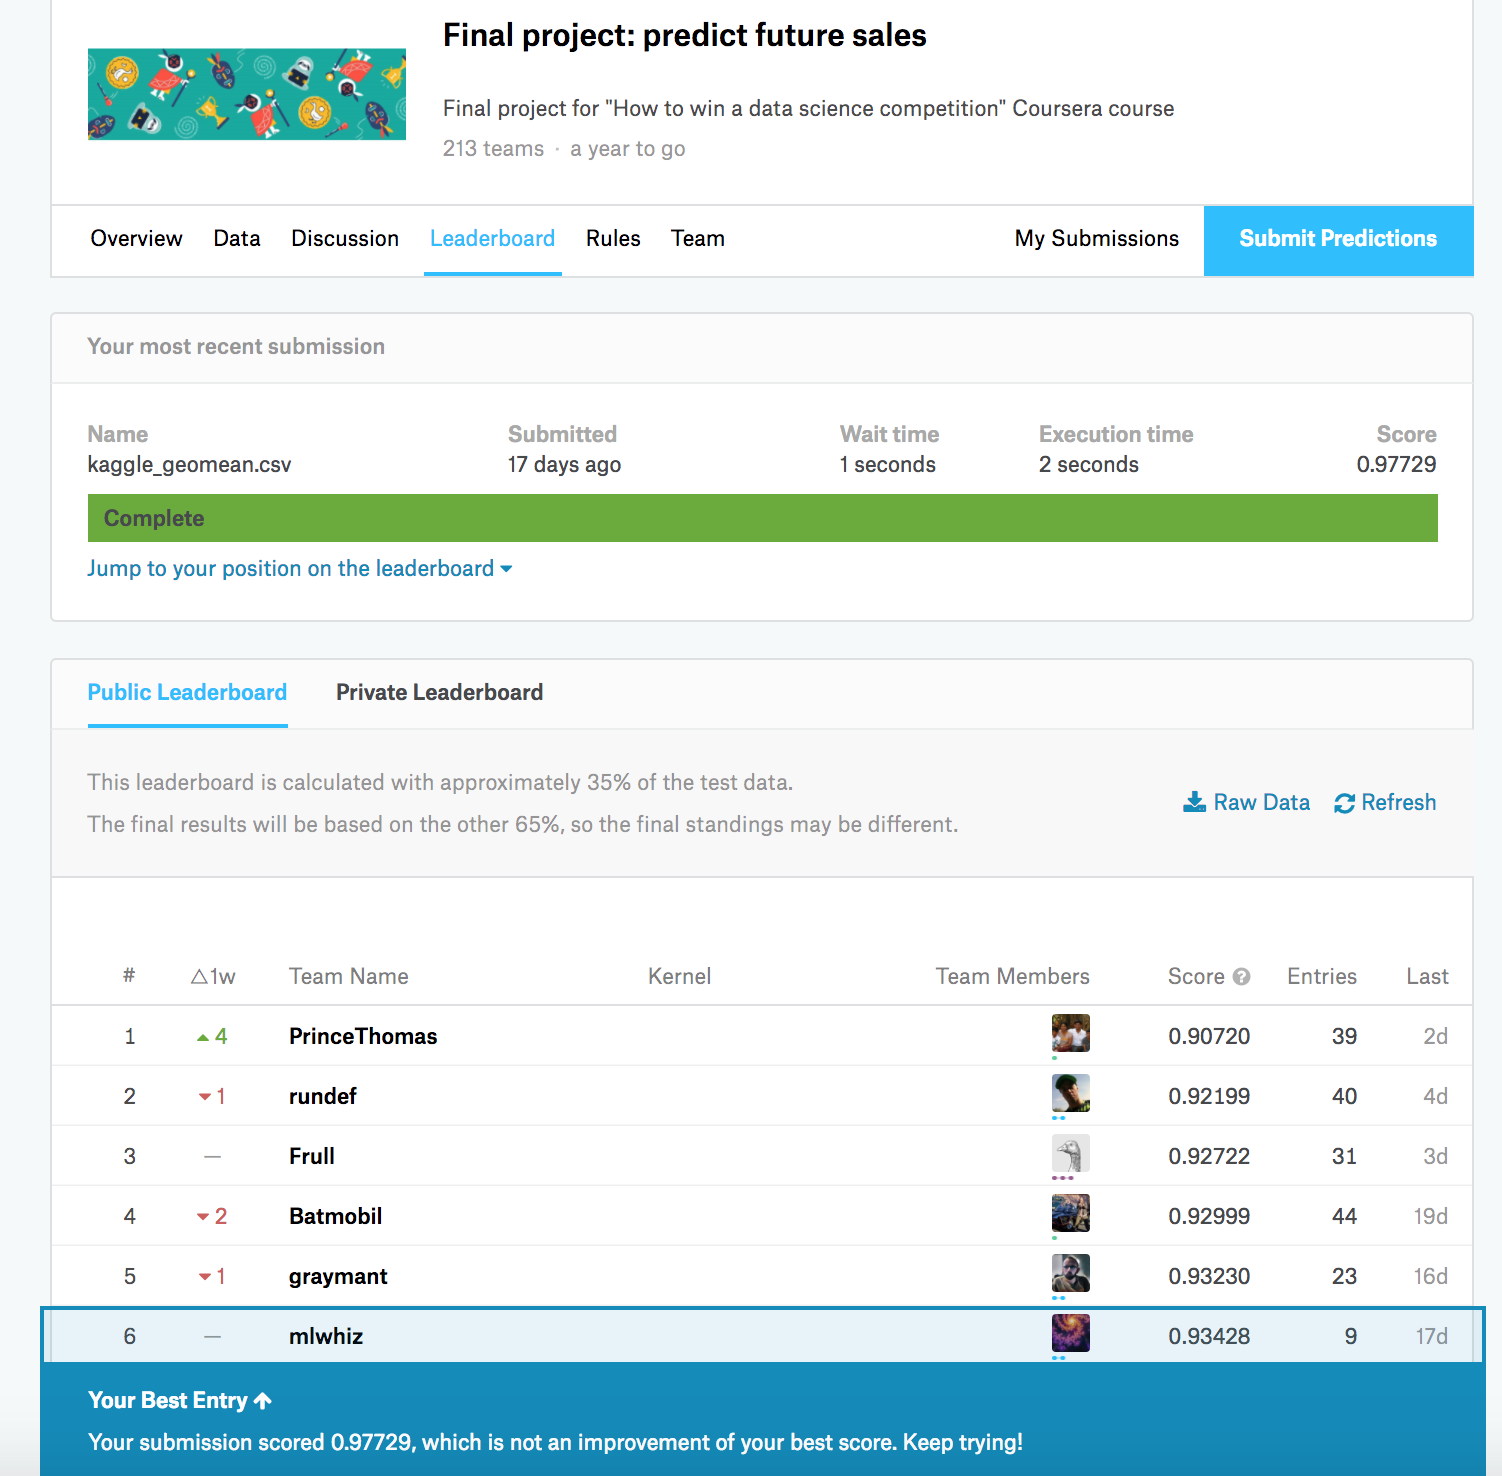
Recently Kaggle master Kazanova along with some of his friends released a “How to win a data science competition” Coursera course. The Course involved a final project which itself was a time series prediction problem. Here I will describe how I got a top 10 position as of writing this article.
In this competition, we were given a challenging time-series dataset consisting of daily sales data, kindly provided by one of the largest Russian software firms – 1C Company.
We were asked you to predict total sales for every product and store in the next month.
The evaluation metric was RMSE where True target values are clipped into [0,20] range. This target range will be a lot important in understanding the submissions that I will prepare.
The main thing that I noticed was that the data preparation aspect of this competition was by far the most important thing. I created a variety of features. Here are the steps I took and the features I created.
1. Created a data frame of all Date_block_num, Store and Item combinations:
This is important because in the months we don’t have data for an item store combination, the machine learning algorithm needs to be specifically told that the sales is zero.
from itertools import product
# Create "grid" with columns

 index_cols = ['shop_id', 'item_id', 'date_block_num']
 # For every month we create a grid from all shops/items combinations from that month
 grid = []
 for block_num in sales['date_block_num'].unique():
     cur_shops = sales.loc[sales['date_block_num'] == block_num, 'shop_id'].unique()
     cur_items = sales.loc[sales['date_block_num'] == block_num, 'item_id'].unique()
     grid.append(np.array(list(product(*[cur_shops, cur_items, [block_num]])),dtype='int32'))
 grid = pd.DataFrame(np.vstack(grid), columns = index_cols,dtype=np.int32)
2. Cleaned up a little of sales data after some basic EDA:
sales = sales[sales.item_price<100000]sales = sales[sales.item_cnt_day<=1000]3. Created Mean Encodings:
sales_m = sales.groupby(['date_block_num','shop_id','item_id']).
agg({'item_cnt_day': 'sum','item_price': np.mean}).
 reset_index()

 sales_m = pd.merge(grid,sales_m,on=['date_block_num','shop_id','item_id'],
 how='left').fillna(0)

 # adding the category id toosales_m = pd.merge(sales_m,items,on=['item_id'],how='left')
 for type_id in ['item_id','shop_id','item_category_id']:
     for column_id,aggregator,aggtype in
 [('item_price',np.mean,'avg'),('item_cnt_day',np.sum,'sum'),
 ('item_cnt_day',np.mean,'avg')]:

         mean_df = sales.groupby([type_id,'date_block_num']).
 aggregate(aggregator).reset_index()
 [[column_id,type_id,'date_block_num']]
         mean_df.columns = [type_id+'_'+aggtype+'_'+column_id,type_id,'date_block_num']
         sales_m = pd.merge(sales_m,mean_df,on=['date_block_num',type_id],how='left')
These above lines add the following 9 features :
- ‘item_id_avg_item_price’
- ‘item_id_sum_item_cnt_day’
- ‘item_id_avg_item_cnt_day’
- ‘shop_id_avg_item_price’,
- ‘shop_id_sum_item_cnt_day’
- ‘shop_id_avg_item_cnt_day’
- ‘item_category_id_avg_item_price’
- ‘item_category_id_sum_item_cnt_day’
- ‘item_category_id_avg_item_cnt_day’
4. Create Lag Features:
Next we create lag features with diferent lag periods on the following features:
- ‘item_id_avg_item_price’,
- ‘item_id_sum_item_cnt_day’
- ‘item_id_avg_item_cnt_day’
- ‘shop_id_avg_item_price’
- ‘shop_id_sum_item_cnt_day’
- ‘shop_id_avg_item_cnt_day’
- ‘item_category_id_avg_item_price’
- ‘item_category_id_sum_item_cnt_day’
- ‘item_category_id_avg_item_cnt_day’
- ‘item_cnt_day’
lag_variables  = list(sales_m.columns[7:])+['item_cnt_day']
lags = [1 ,2 ,3 ,4, 5, 12]

 for lag in lags:    sales_new_df = sales_m.copy()
 sales_new_df.date_block_num+=lag
     sales_new_df = sales_new_df[['date_block_num','shop_id','item_id']+lag_variables]
     sales_new_df.columns = ['date_block_num','shop_id','item_id']+ [lag_feat+'_lag_'+str(lag) for lag_feat in lag_variables]
     sales_means = pd.merge(sales_means, sales_new_df,on=['date_block_num','shop_id','item_id'] ,how='left')
5. Fill NA with zeros:
for feat in sales_means.columns:
if 'item_cnt' in feat:
 sales_means[feat]=sales_means[feat].fillna(0)    elif 'item_price' in feat:        sales_means[feat]=sales_means[feat].fillna(sales_means[feat].median())
6. Drop the columns that we are not going to use in training:
cols_to_drop = lag_variables[:-1] + ['item_name','item_price']7. Take a recent bit of data only:
sales_means = sales_means[sales_means['date_block_num']>12]8. Split in train and CV :
X_train = sales_means[sales_means['date_block_num']<33].drop(cols_to_drop, axis=1)
X_cv =  sales_means[sales_means['date_block_num']==33].drop(cols_to_drop, axis=1)
9. THE MAGIC SAUCE:
In the start, I told that the clipping aspect of [0,20] will be important. In the next few lines, I clipped the days to range[0,40]. You might ask me why 40. An intuitive answer is if I had clipped to range [0,20] there would be very few tree nodes that could give 20 as an answer. While if I increase it to 40 having a 20 becomes much more easier. Please note that We will clip our predictions in the [0,20] range in the end.
def clip(x):
if x>40:
 return 40    elif x<0:        return 0
     else:
         return x
 train['item_cnt_day'] = train.apply(lambda x: clip(x['item_cnt_day']),axis=1)
 cv['item_cnt_day'] = cv.apply(lambda x: clip(x['item_cnt_day']),axis=1)
10: Modelling:
- Created a XGBoost model to get the most important features(Top 42 features)
- Use hyperopt to tune xgboost
- Used top 10 models from tuned XGBoosts to generate predictions.
- clipped the predictions to [0,20] range
- Final solution was the average of these 10 predictions.
Learned a lot of new things from this awesome course. Most recommended.
Originally published on MLWhiz