
The work is done by Jatinder Singh (also co-authored this article) and Iresh Mishra. Also thanks to Saurabh Singh for his guidance.
In past, I had written about how Machine Learning can bring a new era in the clean energy sector and on how are we using a community of ML enthusiast to build the solution. In this article, I will share results from one of the tasks (identifying rooftops from satellite images).
The complexity of the task in hand is increased due to the quality of satellite images from India (and most of the developing world) is of low-resolution. Most similar solutions including Google Sunroof project work on high-resolution images.
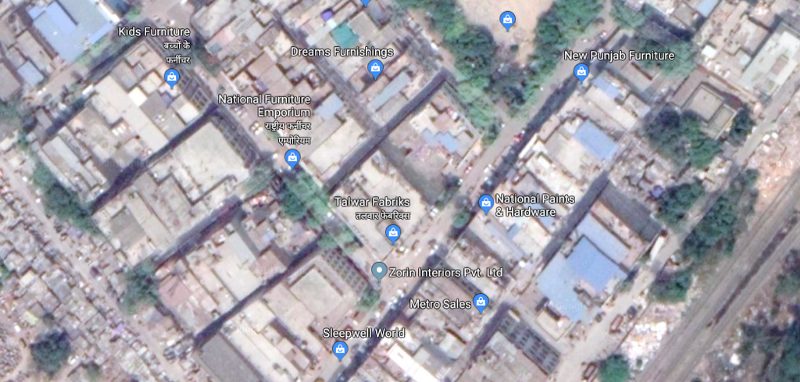
Satellite images of Delhi
Our first step was to identify the best-fit algorithm for the task.
Step 1: Identification of the Algorithm
We initially started with using image segmentation algorithms from computer vision. The goal was to segment the image into roofs and non-roofs by identifying the edges of the roofs. Our first attempt was to use Watershed image segmentation algorithm. The Watershed algorithm is especially useful when extracting touching or overlapping objects are in the images. The algorithm is very fast and computation inexpensive. In our case, the average computing time for one image was 0.08 sec. Below are the results from the Watershed algorithm.
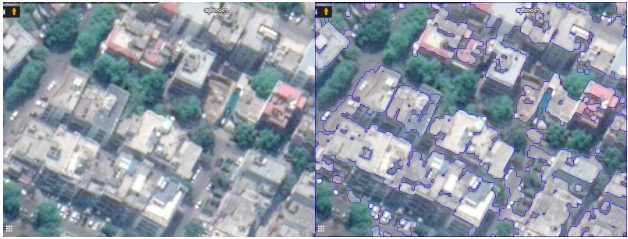
Original image(left). The output from the Watershed model(right)
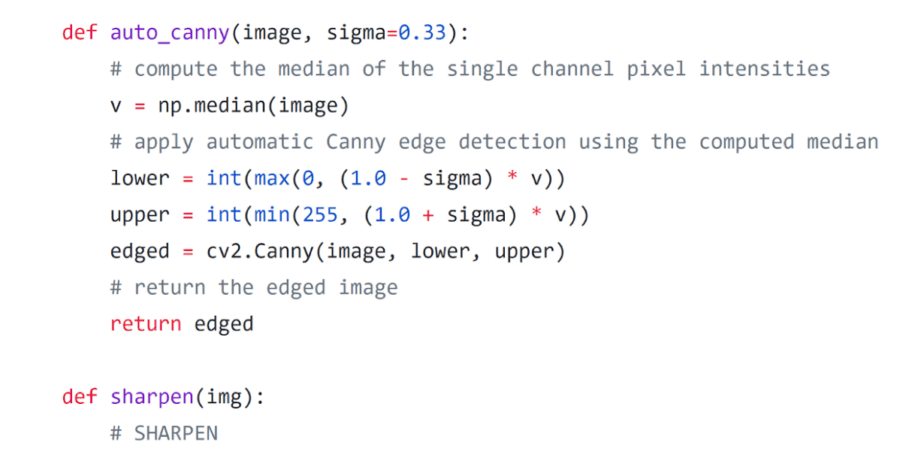
As you can see the output was not very good. Next, we implemented Canny Edge Detection. Like Watershed, this algorithm is also widely used in computer vision and tries to extract useful structural information from different visual objects. In the traditional Canny edge detection algorithm, there are two fixed global threshold values to filter out the false edges. However, as the image gets complex, different local areas will need very different threshold values to accurately find the real edges. So there is a technique called auto canny, where the lower and upper bound are automatically set. Below is the Python function for auto canny:
The average time taken by Canny edge detector on one image is approx. 0.1 sec, which is very good. And the results were better than the Watershed algorithm, but still, the accuracy is not enough for practical use.
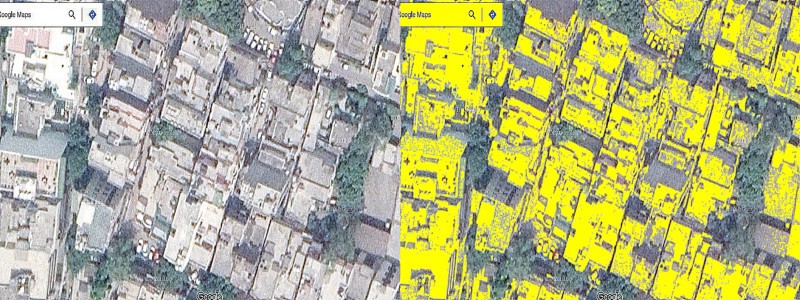
The output from the Canny Edge detection algorithm
Both of the above techniques use image segmentation and work without understanding the context and content of the object we are trying to detect (i.e. rooftops). We may get better results when we train an algorithm with the objects (i.e. rooftops) looks like. Convolutional Neural Networks are state-of-the-art technology to understand the context and content of an image.
As mentioned earlier, we want to segment the image into two parts — rooftop or not a rooftop. This is a Semantic segmentation problem. Semantic segmentation attempts to partition the image into semantically meaningful parts and to classify each part into one of the predetermined classes.
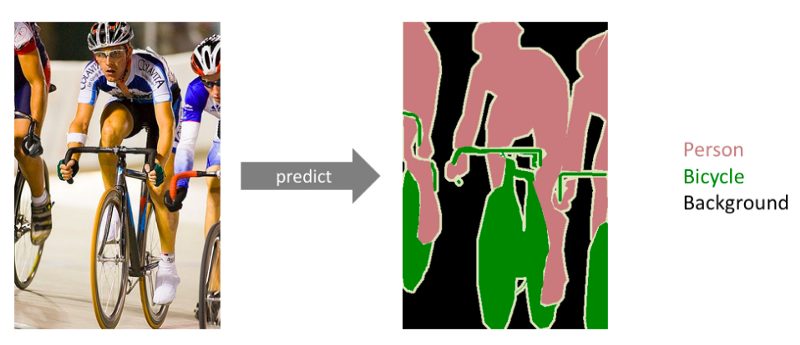
Semantic Segmentation (picture taken from https://www.jeremyjordan.me/semantic-segmentation/)
In our case, each pixel of the image needs to be labeled as a part of the rooftop or not.
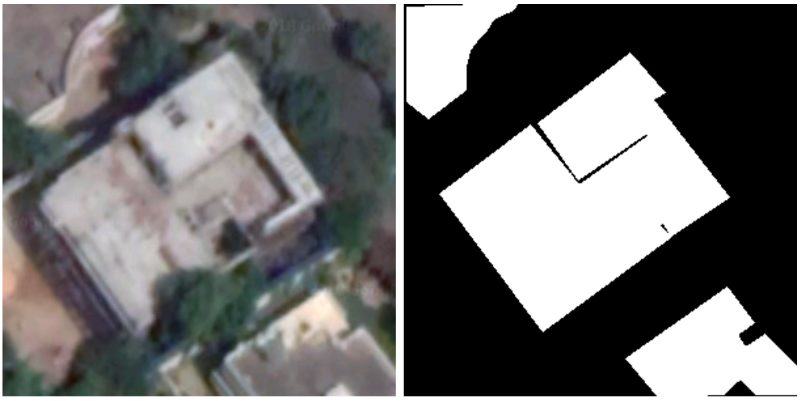
We want to segment the image into two segments — roof and not roof(left) for a given input image(right).
Step 2: Generating the Training Data
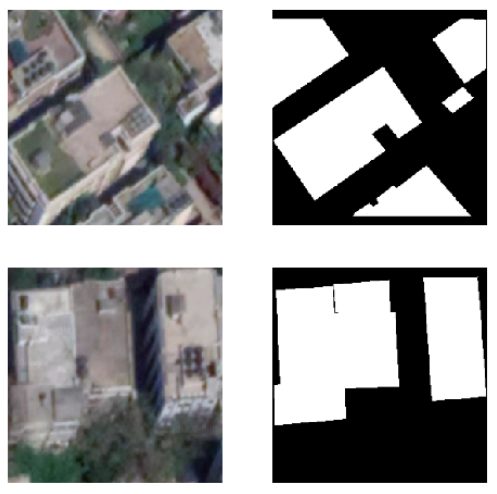
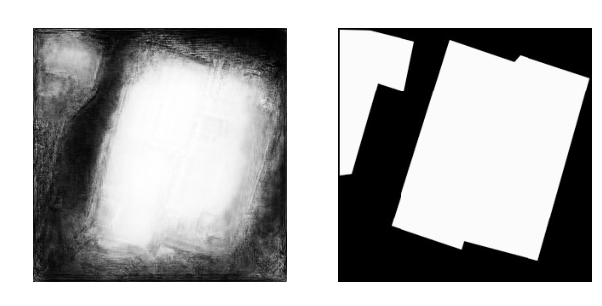
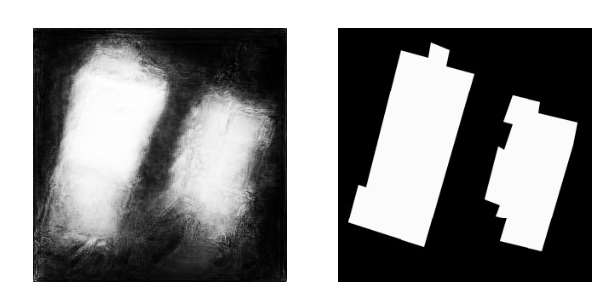
To train a CNN model we need a dataset with rooftops satellite images with Indian buildings and their corresponding masks. There is no public dataset available for Indian buildings’ rooftops images with masks. So, we had to create our own dataset. And here are the final outputs after masking.
Although the U-Net model is known to work with less number of images for data but to begin with, we had only like 20 images in our training set which is way below for any model to give results even for our U-Net. One of the most popular techniques to deal with less data is Data Augmentation. Through Data Augmentation we can generate more data images using the ones in our dataset by adding few basic alterations in the original ones.
For example, in our case, any Rooftop Image when rotate by a few degrees or flipped either horizontally or vertically would act as a new rooftop image, given the rotation or flipping is in an exact manner, for both the roof images and their masks. We used the Keras Image Generator on already tagged images to create more images.
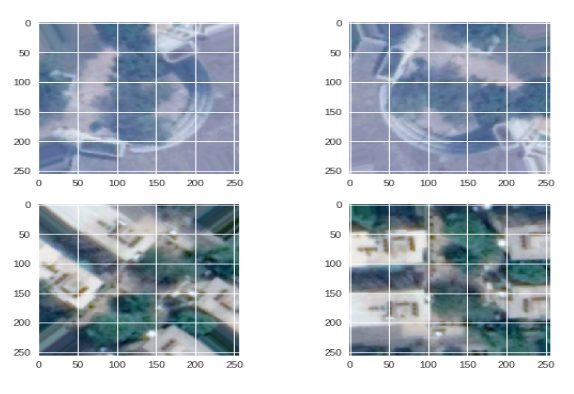
Data Augmentation
Step 3: Preprocessing input images
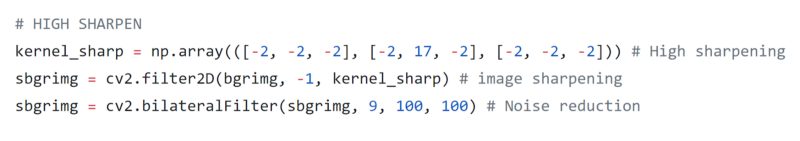
We tried to sharpen these images. We used two different sharpening filters — low/soft sharpening and high/strong sharpening. After sharpening we applied a Bilateral filter for noise reduction produced by sharpening. Below are some lines of Python code for sharpening
Low sharpening filter:
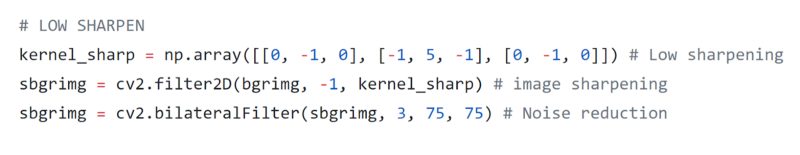
High sharpening filter
And below are the outputs.
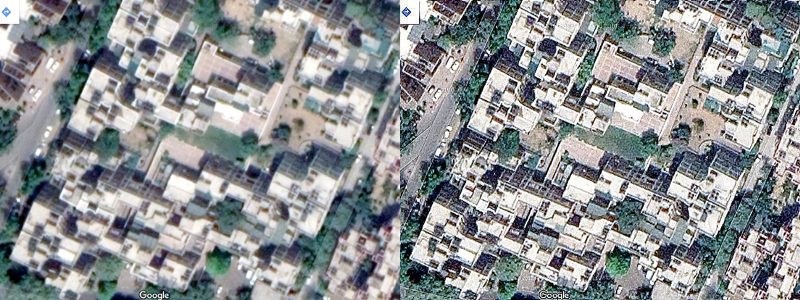
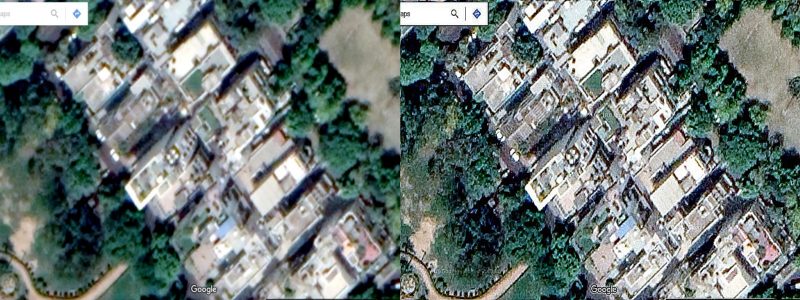
We will write a separate article on sharpening images, so will skip more details here.
Step 4: Training and Validating the model
We generated a training data of 445 images. Next, we chose to use U-Net architecture. U-net was initially used for Biomedical image segmentation, but because of the good results it was able to achieve, U-net is being applied in a variety of other tasks. is one of the best network architecture for image segmentation. In our first approach with the U-Net model, we chose to use RMSProp optimizer with a learning rate of 0.0001, Binary cross entropy with Dice loss (implementation taken from here). We ran our training for 200 epochs and the average(last 5 epochs) training dice coefficient was .6750 and the validation dice coefficient was .7168
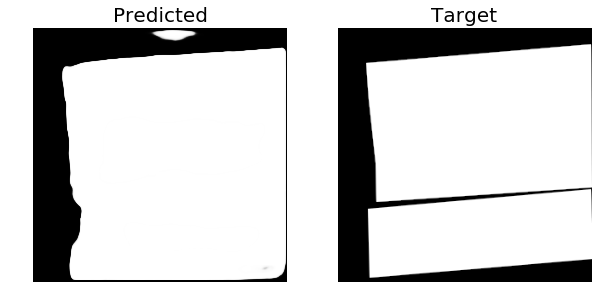
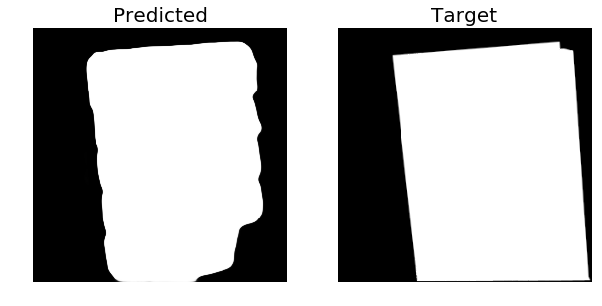
Here are the results of our first approach from the Validation set (40 images):
Predicted (left), Target (right)
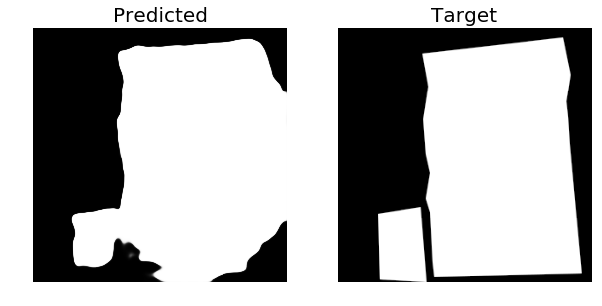
Predicted (left), Target (right)
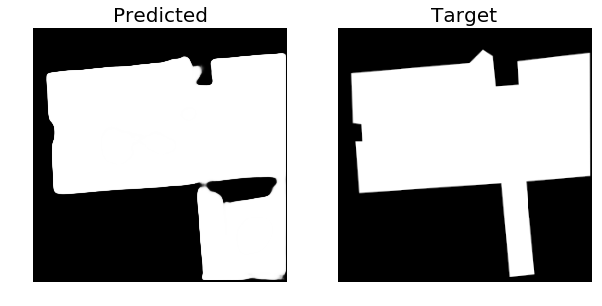
As you can see, in the predicted images there are some 3D traces of buildings structure in the middle and corners of the predicted mask. We have found out that this is due to the Dice loss. Next, we used Adam optimizer with learning rate 1e-4 and decay rate of 1e-6 instead of RMSProp. We used IoU loss instead of BCE+Dice loss and binary accuracy metric from Keras. The training was performed for 45 epochs. Average(last 5 epochs) training accuracy was: 0.862 and the average validation accuracy was: 0.793. Below are some of the predicted masks on the Validation set from the second approach:

And here are the results form the test data
We are excited to see the current results and hope to further improve the results with more data.
Finally, we would also like to thank Abhigyan and Aman for generating the training data. If anyone wants to help us further, please join our git repo or contact [email protected]