
I recently had another client conversation about optimizing their data warehouse and Business Intelligence (BI) environment. The client had lots of pride in their existing data warehouse and business intelligence accomplishments, and rightfully so. The heart of the conversation was about taking costs out of their reporting environments by consolidating runaway data marts and “spreadmarts,” and improving business analyst BI self-sufficiency.
These types of conversations are good – saving money and improving effectiveness is always a good thing – but organizations need to be careful that they are not just “paving the cow path.” That is, are they just optimizing existing (old school) processes when new methodologies exist that can possibly eliminate those processes? Or as I challenged the customer:
“Do you want to report, or do you want to prevent?”
There is a significant number of business and operational use cases where “prevention” is the ideal outcome instead of “optimization” including:
- Instead of reporting on delayed deliveries, how about preventing delayed deliveries?
- Instead of reporting on spoilage, how about preventing spoilage?
- Instead of reporting on the number of students dropping out of your college, how about preventing students from dropping out?
- Instead of reporting on product failures, how about preventing product failures?
In order to prevent, we first need to predict. And if I can predict, then I can prescribe.
Contemplate this “Power of Prevention” thinking. If I can predict (with some level of confidence) each of the situations above, then I can pursue prescriptive analytics in order to try to prevent. For example, what data and analytics might I need in order to:
- Predict which orders are likely to be delayed, so I can prescribe preventative actions (e.g., reprioritize delivery schedule, schedule additional delivery resources, institute delivery logistic tracking)
- Predict which products and produce is likely to spoil so that I can prescribe preventative actions (e.g., aggressively mark down prices, change in-store merchandising, donate before spoilage)
- Predicting which students are likely to drop out so that I can prescribe preventative actions (e.g., tutoring, interventions, curriculum recommendations, study groups, different major)
- Predicting which products are likely to fail so that I can prescribe preventative actions (e.g., early maintenance, scaling back operations and run times, off-loading work load)
Now this is thinking like a data scientist!
Preventative Analytics: Hospital Example
We did a project for a hospital to predict which patients are likely to catch a staph infection (what hospitals call Hospital Acquired Infections or HAI). Staph infections are costly to hospitals due to increased levels of care plus the potential financial and legal liabilities if a patient becomes sick or dies from the staph infection. In order to meet the business use case of “Reducing HAI Infections,” we created a “HAI Score” for every patient (based upon personal data such as their health care history, demographics, current health readings, and family health history; diet, coupled with clustering of “similar” patient situations). Think of it as a FICO score that measures the likelihood of catching a Hospital Acquired Infection while in the hospital.
We used the HAI score to identify patients that we felt had an abnormally high chance of catching a staph infection based upon their current HAI score plus the types of care that they were likely to receive while in the hospital (for example, requiring a catheter was always an area of concern).
If we could predict that a patient had an abnormally high HAI score, then we could prescribe relevant levels of care such as having the patient spend an extra day in the hospital, a regiment of follow up calls to make sure that the patent was taking their medications, and cleaning their wound areas or more frequently doctor check up visit.
The best way to reduce operating and business costs and risks is to prevent them!
And that concept can apply across a multitude of use cases.
Transitioning from Predictive to Preventive
Online returns are a big issue in the rapidly growing world of eCommerce. In 2016, e-retail sales accounted for 8.7 percent of all retail sales worldwide. This figure is expected to reach 15.5 percent in 2021.

Figure 1: E-Commerce Share of Total Global Retail Sales from 2015 to 2021
From an article, some compelling factoids:
- Almost a third of web orders end up being sent back, vs. 9 percent of purchases at physical stores
- The expense of processing and shipping returned items can range from 20 percent to 65 percent of an online retailer’s cost of goods sold
- 75 percent of online shoppers returned merchandise this year by shipping goods back to the merchant
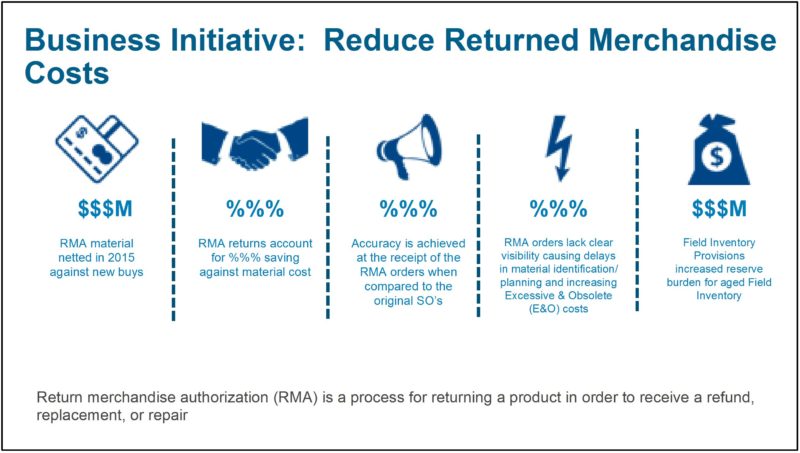
For example, one client with whom I am working is trying to reduce RMA’s or Returned Merchandise Authorizations. The potential cost and risk savings are staggering (note: the details on the business initiative have been scrubbed with the client’s blessing).
One way to address the RMA or returns problem, would be to create “Merchandise Return Likelihood” (MRL) score for each sale – for each individual product for each individual customer – to predict the likelihood of a product or merchandise being returned before it was ever sold. If a customer had a high predicted MRL score, then we might take preventative actions such as:
- Increasing the amount of professional services attached to the product to ensure proper installation and configuration
- Adding a regiment of remote health checkups where we are monitoring the performance data off of the products to predict any early performance problems
- Adding a formal on-site health checkup service where technicians validate that the product is performing to specifications
- Or maybe not even sell the product to the customer if we think the likelihood of return is too high (such as when a single shopper orders multiple versions of the same core product with the obvious intention of keeping just the one that fits)
I think this approach would allow us to “reduce returns” by taking preventive actions to predict the likelihood of product returns so that we can prescribe preventative actions or decisions.
Summary
“The best way to reduce operating and business costs and risks is to prevent them!”
The opportunities to reduce costs by preventing them require a different frame of thinking – to think like a data scientist. While optimizing business and operational processes is good, one must be careful about “paving the cow path” – of optimizing a business or operational process that is out dated. As I challenged a recent client:
“Do you want to report, or do you want to prevent?”
Sources:
Figure 1: E-Commerce Share of Total Global Retail Sales from 2015 to 2021
[1] A spreadmart (spreadsheet data mart) is a business data analysis system running on spreadsheets or other desktop databases that is created and maintained by individuals or groups to perform the tasks normally done by a data mart or data warehouse.
[2] FICO score (from Fair Isaac Corporation) measures the likelihood of a borrower to repay their loan or credit; measures a borrower’s ability to repay a loan