
Here is a guest blog from MIT SMR by Sam Ransbotham. Organizations that turn data into insights are gaining competitive advantage through improved connections with consumers.
The 2018 Data & Analytics Global Executive Study and Research Report by MIT Sloan Management Review finds that innovative, analytically mature organizations make use of data from multiple sources: customers, vendors, regulators, and even competitors. The report, based on MIT SMR’s eighth annual data and analytics global survey of over 1,900 business executives, managers, and analytics professionals, explores companies leading the way with analytics and customer engagement.
BIGGER HARVESTS, BETTER RELATIONSHIPS
For many U.S. farmers, improving agricultural productivity while meeting consumer demand to reduce the use of pesticides and chemicals on crops became a goal during the 2000s. To help farmers manage pests, plant diseases, weather conditions, and yields, dozens of startups emerged to offer apps and data services — part of a precision agriculture boom. Many of these companies failed or struggled as data alone proved insufficient; farmers also needed help interpreting the data. By 2016, a new variety of data-oriented service providers was helping farmers apply their harvested data.
For example, WinField United, the seed and crop-protection division of Land O’Lakes Inc., helps farm operators analyze millions of data points from multiple sources, to boost per-acre production. WinField United taps sources such as controlled experiments at test farms, performance data gathered from sensors provided by equipment manufacturers, and extensive weather data. Analytical and decision-support tools use these myriad data sources to present individualized recommendations to the company’s customers. The analytics helps grow more than crops; it fosters loyal relationships with core customers in the process.
According to Teddy Bekele, WinField United’s vice president of agricultural technology, there is a great disparity in the use of technology and analytics among farmers. But for active adopters, the return on investment can be dramatic. “We are working with farmers who were averaging about 150 bushels per acre but, after following our recommendations, are now producing 195 bushels — paying for their incremental investment five times over,” says Bekele.
By helping its customers achieve measurable gains, WinField United strengthens the bonds it has with them, deepening customer engagement. “Farming is very relationship-based, so, on top of the data, our goal is to get them to say, ‘WinField United is giving me the right advice and helping me make the right choices,’” says Bekele. Analytics is helping the company move from a strictly transactional relationship with its customers to one in which it is perceived to be a trusted adviser.
Winfield United’s program exemplifies heightened demand, across industries, for better customer engagement that depends on data and analytics. The 2018 MIT Sloan Management Review Global Executive Study and Research Report provides a detailed examination of data-driven customer engagement. The study is based on our eighth annual global data and analytics survey, conducted during 2017, which included 1,919 managers from 101 countries and interviews with 17 leading practitioners and thought leaders.
Our findings demonstrate a significant increase in the number of organizations that are using analytics to gain a competitive advantage and innovate — a key component of this shift is more effective use of analytics to improve customer engagement. Data and analytics allow organizations to use intelligence from feedback to tailor offerings that improve customer satisfaction. Several factors appear to be at work, including the use of a wide range of data sources, well-developed core analytics capabilities, and integration of artificial intelligence (AI) and the internet of things (IoT) into processes. Companies that have businesses as their main customers (business-to-business, or B2B) are gaining the most benefits from this shift, in part because they are able to share data with customers in a way that directly strengthens their relationship.
Key findings from this year’s research point to the following trends:
- Competitive advantage from analytics continues to grow. More than half (59%) of managers say their company is using analytics to gain a competitive advantage. This is a higher percentage of respondents than in the previous two years.
- Analytics is driving customer engagement. Organizations that demonstrate higher levels of analytical maturity saw a marked advantage in their customer relationships. The most analytically mature organizations are twice as likely to report strong customer engagement as the least analytically mature organizations.
- Analytically mature organizations use more data sources to engage customers. Many organizations are already making use of data from customers, vendors, regulators, and competitors, but Analytical Innovators are more than four times more likely to glean data from all four sources. They also are much more likely to use a variety of data types — such as mobile, social, and public data — to engage customers compared with less analytically mature organizations.
- Sharing data can improve influence with customers and other groups. Sharing data doesn’t mean giving away the farm. Organizations that share their data with others (customers, vendors, government agencies, and even competitors) reported increased influence with members of their ecosystem. Sharing data can enhance a company’s influence with not only customers but also a broad array of other stakeholders.
KEY TRENDS
Competitive Advantage From Analytics Increases — Even Though Terrain Is Shifting
The percentage of respondents who attribute significant competitive advantage to their analytics proficiency has risen for the second year, to 59%, up from 51% in 2015. This upward swing is the result of many factors. Our interviews with industry executives and academics highlight three.
One factor is the use of data and analytics to ward off new competitors that are themselves using analytics to enter fresh markets. Because of the more pervasive use of analytics,1 organizations must continue to improve their use of data and analytics to stay ahead. (See Figure 1.)
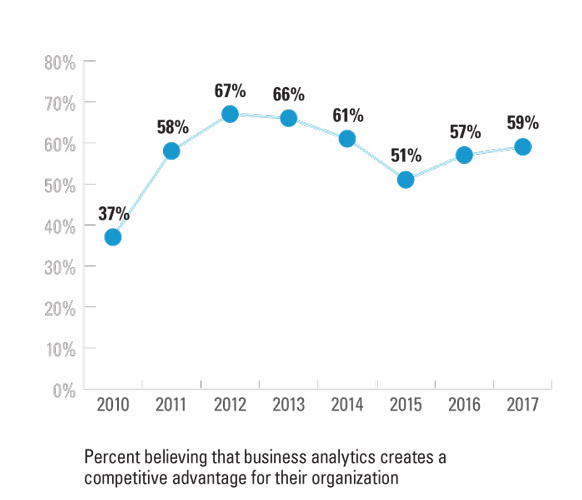
Figure 1: Competitive Advantage From Analytics
Between 2016 and 2017, the share of organizations reporting that analytics creates a competitive advantage rose 2 percentage points.
Consider health insurance. Within the constraints of a heavily regulated environment, the industry has long made extensive use of data and analytics to manage risk — the core competency of its business. Today, however, new competitors — organizations with analytics expertise that has been honed in a largely unregulated environment — are looming. For example, in October 2017, Amazon was granted pharmacy-wholesaler licenses2 in a dozen states, and the market was quick to react, with sell-offs of companies like McKesson Corp. and AmerisourceBergen Corp. The news also affected merger talks between CVS Health and Aetna Inc.3 Industry convergence is forcing some insurers to reconsider their roots as they acknowledge a need to be increasingly data-centric. “You’ve got Amazon considering becoming a pharmacy benefits manager and Google looking at moving into the clinical space, and we’re really going to need to move more in that direction,” notes a business manager we interviewed from a payer organization. “The insurance industry is all about trying to reduce risk, and that’s culturally one of the barriers to admitting we may sometimes need to introduce more of that risk in order for us to disrupt ourselves before we get disrupted by other industries,” he says. Staying the same may be riskier than change.
Another factor is the use of data to enhance customer engagement. Like many brick-and-mortar retailers, Mall of America continually looks for ways to build enduring relationships with its 42 million annual visitors, including a young generation disposed to shop online. While providing the free Wi-Fi access shoppers now expect, the mall uses these hot spots to collect aggregate data about foot traffic patterns, dwell times in particular locations, and the effect of mall events on visitor counts. Robust analytics — and the strategic daily decisions they enable for mall management and retail tenants — has become an indispensable tool that needs continuous refining.
In 2016, with the help of the Carlson Analytics Lab at the University of Minnesota’s Carlson School of Management, Mall of America mapped Wi-Fi data to its floor plans and identified clusters of anonymous shoppers based on their movement through the facility. Similar to online clickstream analytics, the data provided a behavior-based way to track customer segments. The mall also added full-time analysts to its staff. “We are creating a whole analytics mentality,” says Janette Smrcka, Mall of America’s director of information technology. “We now have strong business users who, once they get those dashboards, are really diving in. The more we expose our company to this, the more it spurs ideas.” For instance, Mall of America has begun to use weather data to more accurately predict mall traffic. “In the past, if schools closed due to very cold weather, we could be inundated with traffic unexpectedly, as parents send their kids to the mall,” explains Smrcka. By counting cars in the parking lots and relating the volume to weather patterns, Smrcka is able to provide forecasts to stores inside the mall so that they can adjust staffing levels.
To read original article click here