
My original intent with this article was to write about how to understand statistics in general. However, with the global pandemic on everyone’s minds right now, it seems blithe to write an article on understanding statistics without a nod to current events. If you’re uncomfortable or unfamiliar with statistics, you might find the facts and figures surrounding Covid-19 hard to decipher. Let’s break down the key statistics into plain English and shed a little light on a few terms that will help you digest the news with a little more knowledge.
Basic reproductive number (R0)
What it means in plain English: This is how many people you’ll pass the virus on to.
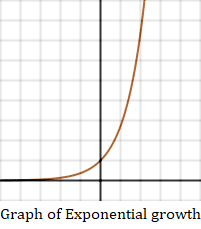
The basic reproductive number (R0) measures how many people are infected by one infected person. Estimates for R0 for the Covid-19 virus are around 2.2. In other words, if you get Covid-19, you’re likely to pass the virus along to about 2.2 other people. That R0 is relatively low (the measles, by comparison, has the highest value at 12-15) but that doesn’t mean it’s less of a problem. In fact, a virus can easily get out of hand if each infected person infects just two others: those two infect four, those four infect eight. That exponential growth means that a single infected individual can lead to one person infecting hundreds of thousands within a few short months.
A word of caution about R0 : the number is affected by many biological, sociobehavioral, and environmental factors. When you add these factors into the relatively complex modeling process, this can result in a figure which is “…easily misrepresented, misinterpreted, and misapplied” (Delameter, et. al, 2019). So, if you’re outside of epidemiology, you may want to consider any R0 as a ballpark figure, rather than one set in stone.
Confidence Intervals
In plain English: We don’t know the exact number, but it’s probably in between these two.
In the above paragraph, I stated that R0 is about 2.2. In statistical terms, we quantify that “about” with a confidence interval.
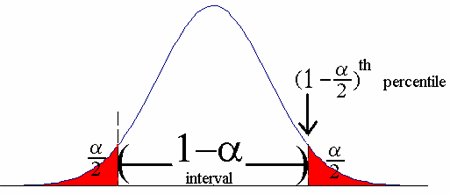
Confidence intervals are really just stating (in a pretty complicated way) that a figure lies somewhere between two amounts. For Covid-19, R0 is actually thought to be anywhere between 1.4 and 3.9 (the confidence interval). In other words, the researcher is confident that the true figure lies somewhere in that interval. But that begs the question, how confident are they? That answer lies in the confidence level.
Confidence Level
In plain English: I’m this confident you would get the same results if you repeat my experiment/survey.
For the above statistic (from Dr. Richard Ellison’s Transmission of the Novel Coronavirus: Early Findings), the stated confidence level for R0 is 95%:
95% CI, 1.4–3.9
What a 95 percent confidence level is saying is that if the survey was repeated over and over again, the new results would match these results 95% of the time.
While confidence levels can go as high as 99%, this is very, very hard to achieve with Covid-19, when vast numbers of mild cases go unreported. Given a perfect world, you could theoretically get a 100% confidence level, but if the world was perfect, we wouldn’t need statistics (we’d just have indisputable facts!).
Another example: Dr. Ellison’s article also includes a confidence interval and level for the estimated mean incubation period: 5.2 days (95% confidence interval, 4.1–7.0). This can be interpreted as, if the survey/research was to be repeated, then 95% of the time, the mean incubation period would fall somewhere between 4.1 and 7.0 days.
IQR
In plain English: The bulk of people are in this range of numbers.
This next statistic was reported in a January 2020 article in The Lancet, titled Clinical features of patients infected with 2019 novel coronavirus …:
“Median age was 49·0 years (IQR 41·0–58·0)”.
In case you’re not familiar with the median, it’s the middle number (as in, the geographic middle) of a set. The median of 1, 2, 3 is 2: it’s right in the center of the ordered list.
The IQR, the interquartile range, is a spread around the median which tells you more about where the bulk of cases lie. You basically take an ordered set of numbers (in this case, a list of age in years from smallest to largest), and chop them up into quarters with the median in the exact middle. Discard the bottom quarter and the top quarter, and what you have left is the IQR: a range from 41 to 58 years old. In other words, most patients are in this age range.
Mann-Whitney and Chi-Squared Tests
In plain English: Here’s how to compare some groups to see if they are different.
The above mentioned Lancet article also refers to continuous variables (compared with the Mann-Whitney U test) and categorical variables (compared by χ2 test or Fisher’s exact test ). In order to perform statistic analysis, you have to identify the type of variable you’re working with. There are dozens of different types of variables, some of which are esoteric, but continuous and categorical variables are fairly straightforward.
Continuous variables go on, and on. Technically, you could try to count them, but you’ll never stop counting. For example, try counting the number of stars in the the universe, or the number of seconds from now until the end of time. The Mann-Whitney U test is a way to compare two such groups (in this case, data from ICU and non-ICU patients) to see if their medians (for example, for various treatments, development of complications or time to recovery) are the same.
Categorical variables are those data points that fall neatly into categories. For example, preexisting conditions: diabetes, heart disease, lung problems. Unlike continuous variables, categorical variables can easily be expressed as percentages and compared by a chi-square (χ2) test or Fisher’s exact test (the latter is more accurate for smaller groups than chi-square). Don’t be scared by these exotic sounding names–they just compare groups; In a more general sense, they test to see whether distributions of categorical variables differ from each another.
Alpha Levels
In plain English: What’s the chances I’m completely wrong?
When you run a statistical test, you choose an “alpha level“. Alpha is the probability of making the wrong decision when the null hypothesis is true. If you’ve never heard of the term “null hypothesis”, you can think of it as what’s the currently accepted situation. In the case of Covid-19, for example, the null hypothesis might be that “Mortality among all infected patients may be in the range of 0.5% to 4%” (Murthy et al., 2020). Your theory (the alternate hypothesis) is that the figure is much higher. With an alpha level of 5% (the standard), you have a 5% chance of reporting that the mortality rate is wrong, when it’s in fact correct.
At this point, you may be wondering why you don’t set your alpha level at 0.0001% so that you will almost certainly report the right results. In simple terms, you can’t because statistical tests are a balancing act. If you lower the risk of one thing happening (making the wrong decision here), you’ll increase the probability of making a wrong decision about something else (in this example, you would increase the risk of a “Type II error“).
Statistically Significant
In plain English: We did the math and it looks good.
This is a wordy way of saying your results have been tested and are found to be sound. Most of the facts and figures you see bandied about on social media haven’t been put to the (statistical) test, so to speak. However, if you read a figure in a journal article (like those I’ve mentioned in this article), someone has done the math, and it all looks correct.
P-values
In plain English: What’s the odds this happened by chance?
This journal article reported that hypertension increases the risk of mortality in the Covid-19 outbreak, WITH A P-VALUE OF .0008. The p-value, or probability value, is easier to understand if you convert it to a percentage: 00.08%. This means there is a 0.08% chance the results could be random (i.e. happened by chance). To put that another way, there’s a 99.92% chance that the findings are correct. Larger p-values (over 5%) equate to more uncertainty: you can’t be sure about your results one way or another.
Did you have another term related to Covid-19 that needs an explanation? Check out these statistics definitions, which cover (with a confidence level of 90%) every statistical topic you’re likely to come across.
References
Delameter et al. (2019). Complexity of the Basic Reproduction Number (R0).
Murthy et al. (2020). Care for Critically Ill Patients With COVID-19.
Transmission of the Novel Coronavirus: Early Findings
Early dynamics of transmission and control of COVID-19: a mathemati…
Manual for the Laboratory-based Surveillance of Measles, Rubella, a…
)