
In this blog, I will be considering theory developments from changes in methodology. But first I want to express an opinion on the significance of using numbers. A “number” represents an amplitude or magnitude: 5 pencils; 13 paperclips; 50 sheets of paper. The purpose of these numbers is to facilitate the counting of things that are presumably the same in a specific way: e.g. all 5 pencils are in fact pencils – for if 1 were an eraser, there would be 4 pencils and 1 eraser. The use of numbers therefore imposes a particular meaning on the data. Statistics works within the parameters of this attachment of meaning. If instead of numbers a person were to deal with symbols and objects, the significance would no longer be dependent on amplitudes. For example, if a company “plans” to implement a process, that planning might be described as a form of “tenacity.” Tenacity can be asserted as the result of planning and implementation. Organizing capital resources for planning is part of planning. Therefore organizing capital resources is part of tenacity. Hiring employees in order to organize capital resources for planning is part of tenacity. Data can be extracted from the workplace using a process of observation and ontological delineation – even before numbers are collected. In short, numbers need structural placement in order to be useful. I believe that in statistics, structural placement might be predefined or undefined. After an impressive analysis showing that a company is headed into the gutter, it might be unclear where the results should be placed or have placement in the organization.
The problem from my perspective is that there isn’t much room for the development of theory when a person is preoccupied with statistics. For one thing, a fair number of people might have no idea what to do with the results of analysis. Then there is the issue of credibility. If decisions are made based on those statistics – and the findings have been portrayed as authoritative and scientific – suddenly that golden idol starts to look kind of brainless and deprived of sense, leaving the skeptics to question the aptitude of the priests. Well, this blog is not actually about me griping about statistics. I don’t have issues with statistics per se but rather any monolithic preoccupation that can contribute to theoretical dead ends. I will be considering my own analytical approach, which I personally consider “nearly” statistical although without the barriers I associate with quantitative analysis.
Crosswave Differential – Practical Example
The data used in this blog is simulated. The situation I am about to share is fictitious. Consider the following: a professional athlete has visited me. “Hello, my name is Amanda. Competitors such as me are being routinely tested for drugs at sporting events. I am looking for natural ways to improve my performance. Please help to personalize my training to help me jump farther.”
Amanda would like to adjust her choice of exercise routines in order to improve performance. I describe this as a “standard application” of the Crosswave Differential: trying to determine what “discretionary events” best contribute to “thematic outcomes.” (I will elaborate on my choice of terms during theory development. In the meantime to avoid confusion, I will simply use “events” to refer to exercise routines and “metrics” for the measured outcomes.) There are 100 possible training routines. For a given day of training, Amanda chooses any 8 routines. She can select different routines each day; or she can follow a program that includes certain core routines plus some periodic changes. My objective is to determine which routines help Amanda jump the farthest. Let’s skip the data-collection stage, however. Assume that I have already collected 2-years worth of data from Amanda.
Before proceeding, I want to discuss how common Amanda’s situation is. An organization might want to know how to improve certain production outcomes given routine processes, conditions, and behaviours. An apothecary might wish to customize his or her choice of herbs and botanical preparations in order to achieve particular outcomes. A person with a chronic condition that cannot be addressed using medication – e.g. old age – might wish to simply live out life as best as possible with the resources at hand, perhaps by adjusting diet and lifestyle choices. A chronic condition that is beginning to affect me – and which I have chosen to address algorithmically – is arthritis. I don’t believe there is a cure for the usual age-related arthritis. There are ways of managing the pain. So here is a situation where I want to minimize the use of medication. Why? Well, the condition will probably be with me indefinitely. I don’t feel inclined to burden the healthcare system or myself with something that tends to develop as bodies get older. If my daily routines and behaviours can be adjusted to minimize the pain, that’s the direction I prefer to go. (I’m not stopping doctors from finding a cure if they are able. A “cure” means that at some point, a person doesn’t have to take medication.)
Specifications
Let us return to the simulation . . .
Number of periods: 2 years x 365 days = 730 periods
Selection of events: 8 exercise routines per period from 100 available
Method of selection: client discretion (non-experimental)
Primary metric: distance achieved on long-jumps
Runtime: here is the data and runtime logs – – – TUFF.zip
Problem: How should the training routine be customized to help Amanda jump farther?
Solution: The exercise routines are numbered from #0 to #99 – from least to most helpful. The customization should therefore emphasize routines having high numbers.
This is a controlled simulation. I already know what results the algorithm “should” return in order to prove its effectiveness. Although the solution is indicated above, the application that I use to calculate the Crosswave Differential has not been supplied any guidance.
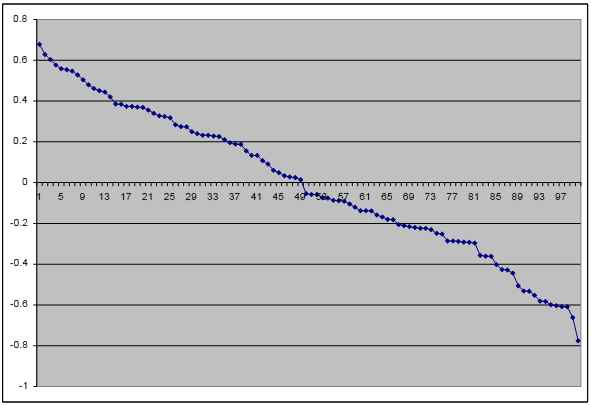
Running the algorithm is a taxing process. The data for this simple simulation takes about 5 minutes and 4 seconds to run on my notebook computer. (Improvements are always possible of course.) After running the algorithm, I sorted the resulting Crosswave Differentials from highest (most helpful) to lowest (least helpful); the results are shown on the chart below. The differentials appear on the y-axis. The x-axis in this case doesn’t mean anything except that there are 100 slots over which to distribute the 100 ordered events. (The numbers that appear along the x-axis are merely increments rather than the labels for the exercise routines.)
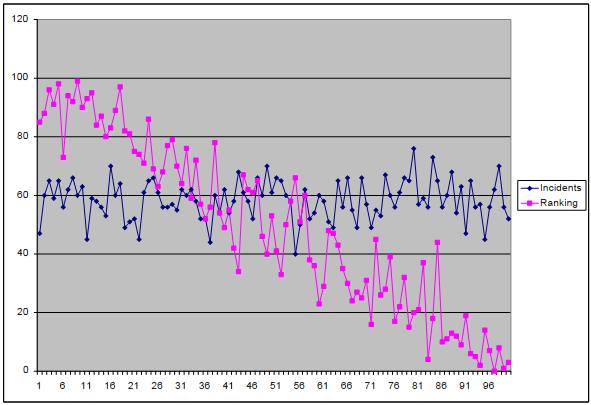
On the next chart, focusing first on the purple line, the y-axis indicates the event label. (Again, the events are labeled from #0 to #99.) For example, exercise routine #85 came first, followed by #88 and then #96. Notice how the distribution of event labels slopes in a similar way to the distribution of Crosswave Differentials on the previous chart.
The blue line is quite a different organism although it just happens to fit nicely on the same chart: the blue line shows the number of instances each event occurred. I present the blue line to confirm that the randomizer is operating in a reasonable manner. Amanda chose to do exercise routine #85 47 times; routine #88 60 times; and #96 65 times.
As I mentioned earlier, each exercise routine actually becomes more effective from #0 to #99. I deliberately set this behaviour. (By the way, the crosswave differential can be based on the distance jumped: in a different application, the metric might be something else such as temperature; particulate count; hormone secretion level; or white blood cell count.) The purpose of the exercise is therefore, using the algorithm, to reveal the behaviour that I engineered into the coding. In the next chart, the event labels are on the x-axis; the Crosswave Differentials appear on the y-axis. This chart confirms that the Crosswave Differential increases while moving from event labels #0 to #99. Although the process isn’t perfect, it’s pretty good.
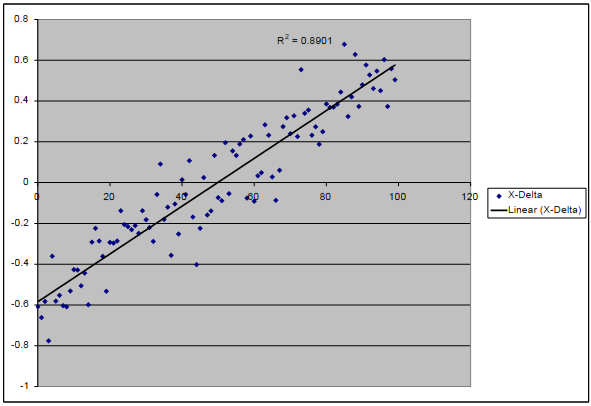
I believe that the main reason for the imperfection is the fact that there are only 10 categories for the metric: e.g. 1m, 2m, 3m, 4m . . . 10m. I apologize for pulling distances out of thin air. (I am not entirely certain how long a professional long-jumper can jump.) I am just trying to explain everything using Amanda’s jumping as an example. Although there are only 10 categories forming the thematic gradient (the metric), there are 100 exercise routines. This means that in this simulation, the processing environment must be indifferent about events #92 and #98 – both occupying the same category despite #98 being more useful for jumping than #92. Another good reason for the imperfection is the fact that the data is uncontrolled while the number of periods is finite if not rather small. Amanda possibly failed to do her exercise routines often or differently enough to give the algorithm adequate clarity. Still, a correlation of 0.9435 seems pretty good.
Summation of outcome: the algorithm successfully determined the relative differences between events; taking these differences into account can help clients achieve their outcomes.
I kept the dimensions of the exercise simple to help others reason through the process. In practice, it is possible to add many metrics and events. For example, apart from long-jump distance, hardly any extra effort is needed to also record running speeds, hurdles cleared, and high-jump distances. Meanwhile, along with exercise routines, it is just as easy to also include meals eaten; medication taken; herbal treatments; and other activities. The only cost is in data processing time – which is certainly not to be ignored. The algorithm can be used as part of a non-interventionist and non-experimental approach to research. Because of this “gentle” entry into the everyday lives of people, all of the quotidian events can remain in place for inclusion in the analysis.
Theory Development
I tend to consider statistical problems differently because of the Crosswave Differential algorithm. Amanda’s case is deceptively quantitative because the thematic gradient (the distance jumped) can be expressed as a quantitative metric. This numerical affiliation is at least in part an illusion. The gradient can for example be based on the progression of disease based on professional experience. I probably haven’t listed all of the points that tend to come to mind; but I hope the listing below provides an indication of how much room exists for theory development in relation to the algorithm.
1. Usefulness Limited by Availability of Metrics
It might be worth asking, would this sort of algorithmic process be useful on a common condition affecting millions of people such as baldness or premature hair loss? I don’t think so, probably not yet. However, we are moving in this direction. I am unaware of a metric available to help guide events – specifically in relation to baldness. I specifically chose a simulation example containing an easy metric. Now, the fact that a metric exists does not necessarily mean that it is on par with Amanda’s jumping distance. Organizational metrics for example are sometimes based on criteria rather than simple measurement: e.g. performance; commitment; reliability; and quality. It is therefore necessary to question the nature of the metric and the process of metrification.
2. Family Ties – Filial Ecology Between Events
I once posted a year-end blog revealing to readers that I have difficulty digesting fruit. In order to make such an assertion, the “fruitiness” of related events must be established: e.g. [pear], [apple], [grapes], [strawberries], [banana], [cherries], [plums] are related. In order for the assertion to be reasonable, the family members should generally and convincingly occupy a place below zero in a distribution of Crosswave Differentials. I am not an expert in kinesiology. But in Amanda’s case, exercise routines that focus on certain aspects of the body might be regarded as “related.” I suspect that the relationships do not have to be muscular: they can be lymphatic, skeletal, and proximal or distal to certain focal areas. This is not a conversation that seems particularly meaningful in statistics. I am not saying that it is impossible to draw the same conclusions using statistics if the data is posed correctly. A system based on events would likely establish the fault of the family. A system based on quantities would tend to find fault in the quantities – i.e. the amounts of fruit or the number of people consuming the fruit.
Take for example the case of an apothecary gathering botanicals. What kind of filial relationships exist in the events? Some botanicals might be related on a purely genetic level. Filial connections might also exist in the following: location in the garden or forest; history of the land; condition of the topsoil; physical attributes of the species; nature of surroundings; proximity of notable landmarks such as golf courses and cemeteries; types of animals that frequent the area. If that all seems far-fetched, do some reading on where coffee beans are grown. If great coffee can be grown anywhere, we would be growing coffee in Toronto.
3. Event Construction Need Not Be Flat
I chose to treat exercise routines as separate “events.” But when is an exercise routine an exercise routine? If a person does sit-ups, push-ups, and jumping jacks on one routine and sit-ups, push-ups, and knee bends on another routine, isn’t the former event much like the latter? There has to be a discussion on when to recognize an event and why. Events can be thought of symbolically or as complex objects. For example, in the case of bullying in schools, an object might be a body of policies dictating the administrative or institutional response. Upon deconstructing the object, a large number of events would be revealed. There can therefore quite an extensive conversation on the structure of complex objects.
4. Determining Nature of Events
An event ideally is something that can be controlled or influenced; in the case of this blog, it is Amanda’s choice of exercise routine. (Pertinent “events” in complex organizational situations might be determined through analysis of narrative.) But in some cases, it isn’t clear whether an event can be controlled. Something apparently found in myth and lore involves the moon’s influence over the behaviours of people. It is certainly not possible for people to influence the movement of the moon. But if, for the sake of argument, it isn’t gravity or position but rather moonlight and moon presence that affects people, presumably it would be possible to counteract the effects by having people remain in enclosed environments.
5. Significance of Events Chosen
Sometimes the events being examined simply have no influence on the metrics. While it is reasonable to think that Amanda’s training routine can affect her ability to jump, it seems improbable for movies and television shows to help. Here choice of movies seems entirely disassociated. My high school Latin teacher once said that some Latin people hurled birds at walls to foretell the future; they predicted the future by studying how the entrails splattered from the birds. I am no expert on bird entrails, but I suggest that the poop patterns (the events) are not even coincidentally related to the outcomes. Sometimes events are intrinsic to the person. They can also be external as part of the surrounding environment. The event might be a symbol of something initiated; or it might be a symbol of the thing being completed; or it might be a symbol of the consequences of completion
6. Conception – Authority and Phenomenology
Events are usually shaped by somebody. The person shaping those events exercises ontological control over the data. In the case of Amanda, the events are fairly straightforward – and also possible to confirm by visual inspection. But in day-to-day life, the events that a person encounters and experiences might carry a particular meaning and significance within the specific context of that individual. I would say this is especially true in relation to production where a manager might have a great interest in particular types of events, thereby commandeering and externally imposing meaning. Be prepared to consider when things exist and the power and control dynamics surrounding the state of being.
7. Invocation – Events Are Triggered Not Refreshed
It is possible to determine the state of something by scanning its condition repeatedly: e.g. checking if an electronic file has been deposited into a particular folder. A conceptually different approach is to trigger an event after a particular condition occurs: e.g. after a key is pressed on a keyboard. In the case of the former, a relational database structure is possible. But in the latter, the database must not be confined. In the case of a long-jump by Amanda, there might be a broad range of events since the database is free to hold any number. I am not really focused on the quantity of events but rather the extent and depth to which events are recognized, which can vary between jumps depending on the evaluation. Unless processing resources are unlimited, event formation and deployment need to be considered carefully.
8. Determining Thematic Outcomes
Not really highlighted in this blog until now is how the algorithm makes use of a “thematic gradient.” It just so happens that a long-jump theme is fairly straightforward: the longer the jump, the greater the measurement. Themes are likely less coherent in, say, a business setting. A great deal of time and deliberation might be needed to develop themes. (A theme is something that might be determined through the analysis of narrative.) A theme describes how a body of metrics is associated. The construction of a theme isn’t really about getting numbers at the end – as in the case of Amanda on the surface – but rather results or instrumental outcomes: e.g. “How should we organize these metrics in order to give rise to specific interactions to achieve particular outcomes?” Amanda isn’t really interested in 9m or 10m per se but rather jumping as far as possible. Similarly, an organization might not be interested in producing 5,000 units or 10,000 units specifically but rather establishing a foothold in a foreign market; the metrics might provide no guidance in terms of success – only in terms of production.