
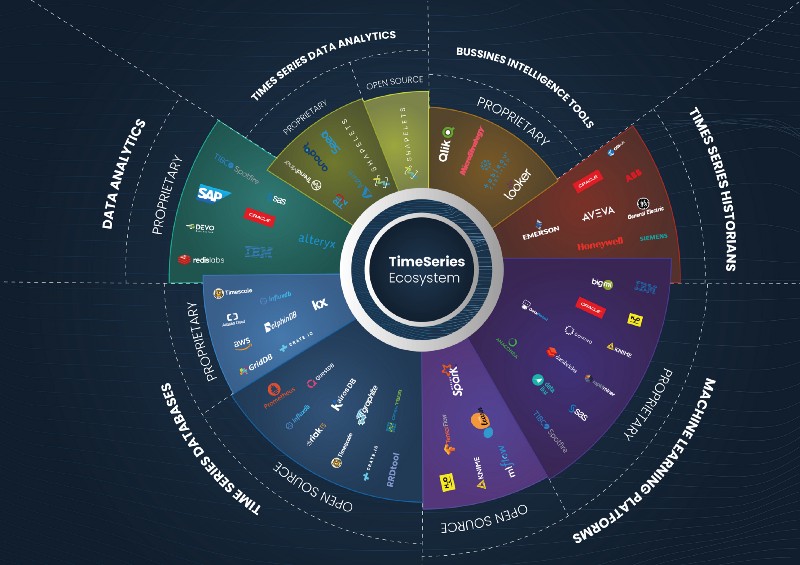
The Time-Series ecosystem
Time-series analysis has been studied for more than a hundred years, however, the extraordinary growth of data available from numerous sources and more frequent growth of data alongside the growth of computer power (GPU & Multicore) makes the analysis of large-scale time-series data possible today in a way that was not previously practical.
The use of time-series data has been traditionally linked to sectors where time is not just a metric but a primary axis, such as in finance, Industrial IoT, and energy. However, in the last 10 years, it is starting to be generally used in other sectors such as marketing, gambling, or any other sector where performance monitoring and time-series analysis is needed.
There are three main solutions in the ecosystem to treat, analyze, and visualize time-series data. These are Time-series Databases, Time-Series Data Analytics Solutions, and Machine Learning Platforms. Apart from these, there are also generalist data analysis and BI tools that incorporate some specific features for time-series, but our main focus will be on the first three solutions mentioned.
Let’s see who the main players from each solution are.
Time-Series Databases
A History of Historians
The very first technology used to digitalize and manage time-series data dates back to the 1980s in what is called operational historians. Historians are prehistoric versions of time-series databases mainly used in the industrial and manufacturing sector with a focus on collecting data from heterogeneous environments. They are typically used alongside Programmable Logic Controllers (ruggedized industrial digital computers) and Distributed Control Systems (Computerised control systems for a process or a plant) with their main task being to monitor all critical systems in industrial plants.
Some of these historians’ providers are big conglomerates, such as General Electric, ABB, or Emerson Electric. Meanwhile, the leaders in the sector are also software vendors offering this specific solution, such as AVEVA or the market leader Osisoft.
Industrial corporations keep using these solutions to monitor critical systems and are highly dependent on them.
The advantages of historians, which are mainly related to the manufacturing specification these products have been designed for, are the following:
- A great variety of connectors for data collection from all kinds of sensors.
- The capability to handle and compress a huge amount of data.
- Dashboarding for monitoring and data analysis.
- Aggregation, data cleansing, and data enrichment.
However, this specialization for the manufacturing sector also brings many drawbacks, such as:
- Most historians are built on massive amounts of old legacy systems and are not updated to modern best practices of software engineering.
- These solutions are expensive and costly to manage, run, and customize, which is the reason why most of them are offered alongside consulting services or a support team, which means an extra cost.
- These solutions are complex and difficult to integrate with modern systems.
The First Players
In the 90s, with the advent of new technological advances, the first time-series databases as we currently know appeared.
The first time-series database was most likely Kdb+, a proprietary solution for the financial sector created by an ex-Morgan Stanley and UBS employee, Arthur Whitney. Kdb+ is a column-based relational time-series database with in-memory capabilities, whose first release was in 1998. It is mainly used in high-frequency trading and was developed in a very peculiar language called q. Kdb+ is extensively used in the financial sector and is currently the second most popular time-series database in the world, according to the DB-Engine ranking. According to different reviews, Kdb+ is a very powerful tool but expensive and difficult to learn and work with. Around the same time, the first open-source time-series database, the RRD Tool, appeared. This piece of software came about after the initial creation of the MRTG program aimed to monitor the network of the students from De Monfort University of Leicester in the UK.
The creator of the RRD Tool is the Swiss engineer, Tobias Oetiker. The idea originally came from the program, MRTG, which he so happened to create while working as a system administrator trainee in 1995. Tobias was inspired to make another program that could be used as a standalone time-series database. Years later in the summer of 1999, Tobias was able to complete this program during a work exchange in San Diego, California with the company CAIDA. Tobias was able to release the first version of the RRD Tool, which continues to be one of the most popular time-series databases in the world.
Years later, a similar story happened with the open-source project Graphite. Graphite started out as a side project by Chris Davis, a software engineer working at the travel aggregator, Orbitz. Chris created this tool as a foundational monitoring tool to track the performance of their websites, applications, business services, and networked servers in 2006. The company authorized Chris to make it open-source, and the project was released in 2008 under the Apache 2.0 license. It quickly became a very popular tool that has been used by companies like Etsy, Booking.com, and even Github.
During this time, Kdb+ continued evolving up until today, offering new features and capabilities, while expanding its operations to other sectors. On the other hand, RRD Tool and Graphite have been maintained by the community, keeping its main features limited in terms of simple data models and standalone capacity.
Big Data Series
In the last 10 years, the rise of Big Data and the need for high scalability have caused the real emergence of many time-series databases projects and companies.
One of the main characteristics of this new wave of time-series solutions is that most of them are either open-source or at least offer an open-source version of their product.
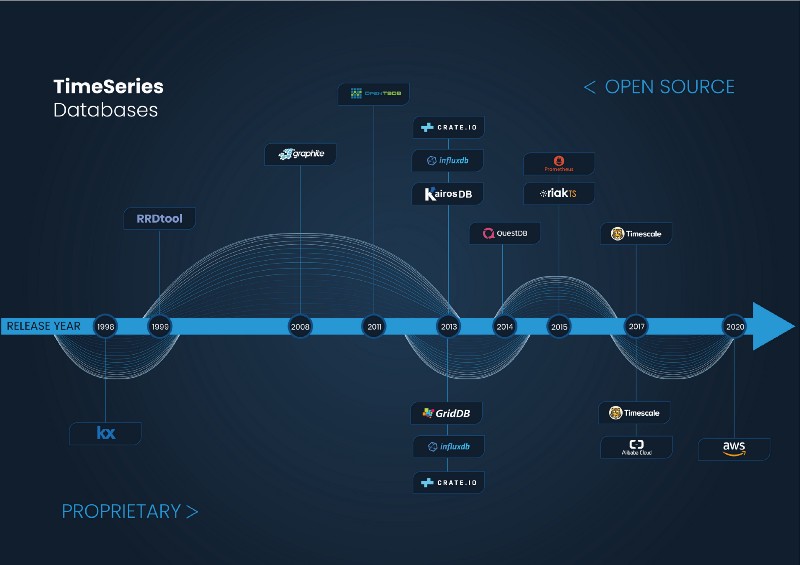
Time-Series Databases release year
It is obvious that time-series data is becoming more and more popular. This popularity can clearly be seen in the classical DB-Engine graph that appears in almost every single time-series database blog page. This graph explains how over the last 24 months, time-series databases have been the fastest-growing category among different databases.
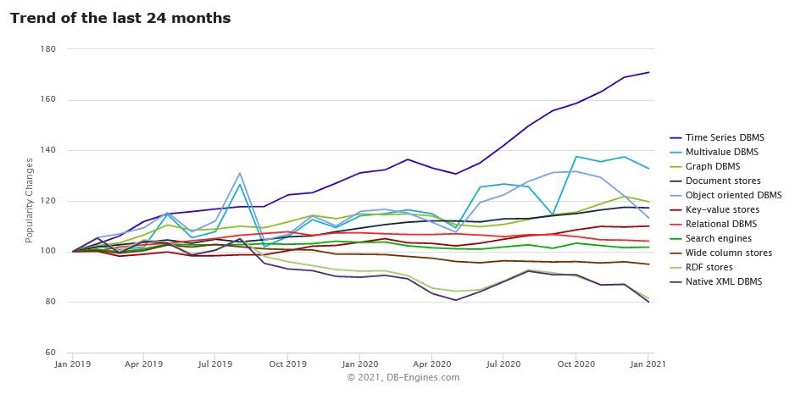
DB.Engines Databases trend as for Jan 2021
In terms of functionality, most time-series databases offer the ability to store time-series data in an efficient and scalable way, with the possibility to perform queries through SQL, NoSQL, or a DSL (in the case of influx with Flux). They also offer considerably basic analytics functionalities, mainly focused on data transformation or normalization.
As it usually happens in the database world, there is a hard fight between the main actors, regarding the high performance and scalability of databases. There are numerous posts and benchmark studies comparing the performance of one database versus another. In an interview with David G. Simmons, former Developer Evangelist of Influxdata and QuestDB, he was asked how he saw these benchmarks. His response brought great insight when he mentioned that his mother was a well-renown expert in benchmarking supercomputers and she used to say that “there are lies, damn lies, statistics, and then there are benchmarks.”
It is also worth mentioning that most time-series databases do not offer a visual layer, and what they usually do is to integrate with Grafana, or first with Prometheus and then with Grafana. Because of this, Grafana has successfully established itself as the default visualization tool for most time-series databases.
With regards to the most common solutions provided by the main time-series databases, there are three worth mentioning:
- DevOps and infrastructure monitoring on large scale deployments
- IoT monitoring
- Network monitoring
Time-Series Data Analytics Solutions
Data analysis solutions for time-series are relatively new in the market. They are not focused on collecting or storing data but rather on the analysis and the visualization of the data.
As well as modern time-series databases, these products have also appeared in the last 10 years with the rise of Big Data.
One of the main peculiarities of these solutions is that most of them are proprietary; their company size is smaller than historians or time-series database vendors.
Common features and use cases offered by these products are models of anomaly detection, aggregated statistical averages, pattern recognition, as well as classification and predictive models.
Among the more traditional time-series analytics platforms, Seeq, Trendminer, and Trendalyze stand out. These companies are focused on the industrial sector and offer their solutions as a complement to the analytical and BI part of operation historians. In general, the interfaces of these solutions usually have a very strong industrial look and feel with a resemblance to a large Excel dashboard.
Apart from these solutions, it is important to mention three other time-series analysis platforms that offer a more contemporary look and feel and are not only focused on industrial sectors. They are Anodot, Azure TS Insights, and Shapelets.
Anodot is an Israeli company that offers monitoring solutions in digital sectors, such as gambling and e-commerce, finance, and telecommunications.
Azure TS Insights is a Microsoft project, focused on IoT companies, that complements other Azure storage tools from the Redmont giant and offers a simple yet intuitive interface.
Finally, Shapelets is a Spanish company that offers an open-source library of innovative time-series analytics (pattern discovery, causality, motifs and discords) as well as a proprietary platform. Its use cases are focused on sectors such as energy, industry IoT, aeronautics, and health.
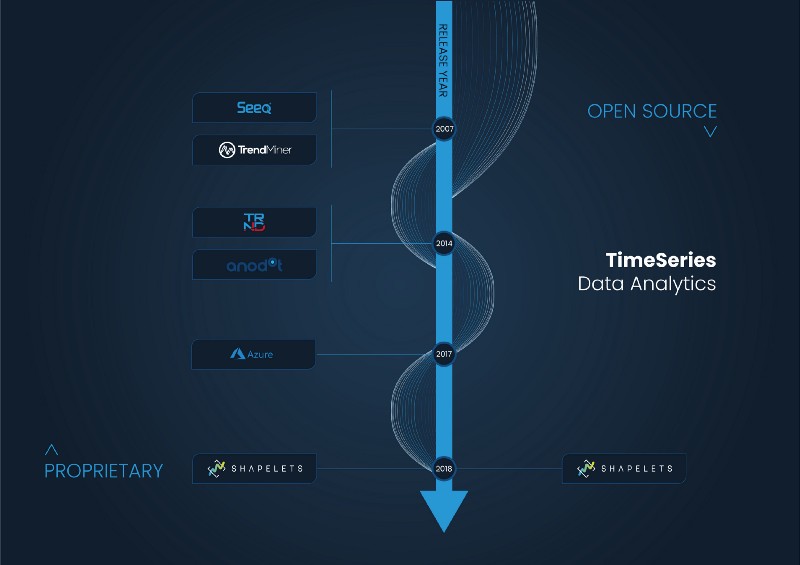
Time-Series Data Analytics solutions
Machine Learning Platforms, Data Analysis, and BI Tools with TS Features
Lastly, another important aspect to highlight is the tools that offer Machine Learning techniques, data analytics, as well as BI tools that have specific functionalities for time-series analysis.
Machine Learning solutions include H2O.ai, DataRobot, Knime, or Databricks (together with the tools of the Spark ecosystem). These solutions offer different options for automation, manipulation, and the creation of models with the capacity to find anomalies and make predictions using classic time-series algorithms.
These vendors usually offer proprietary and open-source products to engage with data scientists that are easily integrated with open-source machine learning libraries, such as Tensorflow, Scikit-Learn, or MLFlow.
Among the data analysis solutions, apart from the big players such as IBM, SAS, Oracle, etc., there is an endless number of software vendors, such as Redislabs, Devo, Alteryx, Datameer, etc. These software programs offer some functionality focused on time-series. Among the most common are anomaly detection, system and application monitoring, aggregations, and other simple operations for time-series modeling.
Finally, we must mention data visualization/ business intelligence software companies such as Tableau, Qlik, Power BI, Looker, and Microstrategy. These platforms offer proprietary software consisting of a visual layer for time-series exploration and some of them include simple built-in analytical functions.
In conclusion, the ecosystem of solutions for time-series data has grown exponentially in the last 10 years with the advent of new technologies to manage data more efficiently and in a distributed manner. New academic research, like the Matrix Profile, has also added many new analytic approaches to get insights from time-series data.
In evaluating the direction of time-series data, we can see that data storage is well established with various free options available. Even data monitoring and troubleshooting have been present in the time-series ecosystem for years. These are important solutions for time-series data, but what seems to be key in further advancing the time-series ecosystem are the tools to help identify the interesting data.
In the upcoming years, we can expect to discover new storage solutions with higher performance and better scalability, but the real advantages will come from the analysis of time-series data. As the creator of the RRD Tool, Tobias Oetiker, says the future of time-series software is in “automatic systems, whether you call it machine learning or [by any other term], which analyzes and shows you the interesting bits out of the huge amount of data we collect.”