
Interaction plots are used to understand the behavior of one variable depends on the value of another variable. Interaction effects are analyzed in regression analysis, DOE (Design of Experiments) and ANOVA (Analysis of variance).
This blog will help you to understand the interaction plots and its effects, how to interpret them in statistical designs, and the problems you will face if you don’t include them in your statistical models. In any statistical study, whether it’s a product development, manufacturing process, simulation, health, testing and so on. Many variables can affect the expected outcome (Response). Changing/adjusting these variables can affect the outcome directly.
Interactions plots/effects in Regression equation:
- To determine if two variables are related in a linear fashion
- To understand the strength of the relationship
- To understand what happens to the value of Y when the value of X is increased by one unit
- To establish a prediction equation that will enable us to predict Y for any level of X
- Correlation is used to measure the linear relationship between two continuous variables (bi-variate data)
- Pearson correlation coefficient “r” will always fall between –1 and +1
- A correlation of –1 indicates a strong negative relationship, one factor increases the other decreases
- A correlation of +1 indicates a strong positive relationship, one factor increases so does the other
Interaction Plots/effects in Design of Experiments (DOE):
The analyze phase of DMAIC (Define Measure Analyse Improve and Control) process narrowed down the many inputs to a critical few, now it is necessary to determine the proper settings for the vital few inputs because:
- The vital few potentially have interactions
- The vital few will have preferred ranges to achieve optimal results
- Confirm cause and effect relationships among factors identified in analyze phase of DMAIC process (e.g. regression)
- Understanding the reason for an experiment can help in selecting the design and focusing the efforts of an experiment
Reasons for design of experimenting are:
- Problem Solving(Improving a process response)
- Optimizing(Highest yield or lowest customer complaints)
- Robustness(Constant response time)
- Screening(Further screening of the critical few to the vital few X’s)
Problem Solving:
- Eliminate defective products or services
- Reduce cycle time of handling transaction processes
Optimizing:
- Mathematical model is desired to move the process response
- Opportunity to meet differing customer requirements (specifications or VOC)
- Robust Design
- Provide consistent process or product performance
- Desensitize the output response(s) to input variable changes including NOISE variables
- Design processes knowing which input variables are difficult to maintain
Screening:
- Past process data is limited or statistical conclusions prevent effective characterization of critical factors in analyze phase
Interaction Plots/effects in Anova:
Analysis of Variance (ANOVA) is used to determine if there are differences in the mean in groups of continuous data.
Power of ANOVA is the ability to estimate and test interaction effects.
There are 2 ways - One way ANOVA and Two way ANOVA
- A one-way ANOVA is a type of statistical test that compares the variance in the group means within a sample whilst considering only one independent variable or factor.
- A two-way ANOVA is, like a one-way ANOVA, a hypothesis-based test. However, in the two-way ANOVA each sample is defined in two ways, and resulting put into two categorical groups.
Example of using Interaction plots in Anova:
The main effects plot by plotting the means for each value of a categorical variable. A line connects the points for each variable. Look at the line to determine whether a main effect is present for a categorical variable. Minitab also draws a reference line at the overall mean.
Interpret the line that connects the means as follows:
- When the line is horizontal (parallel to the x-axis), there is no main effect present. The response mean is the same across all factor levels.
- When the line is not horizontal, there is a main effect present. The response mean is not the same across all factor levels. The steeper the slope of the line, the greater the magnitude of the main effect.
Interaction plot example from ANOVA showing running time, type of marathon and strength
Interaction effects/plot Definition:
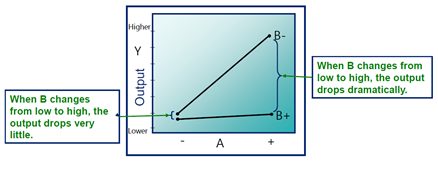
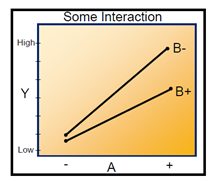
Interactions occur when variables act together to impact the output of the process. Interactions plots are constructed by plotting both variables together on the same graph. They take the form of the graph below. Note that in this graph, the relationship between variable “A” and Y changes as the level of variable “B” changes. When “B” is at its high (+) level, variable “A” has almost no effect on Y. When “B” is at its low (-) level, A has a strong effect on Y. The feature of interactions is non-parallelism between the two lines.
While the plots help you interpret the interaction effects, use a hypothesis test to determine whether the effect is statistically significant. Plots can display non-parallel lines that represent random sample error rather than an actual effect. P-values and hypothesis test help you sort out the real effects from the noise.
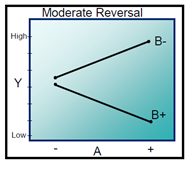
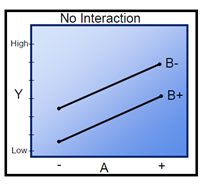
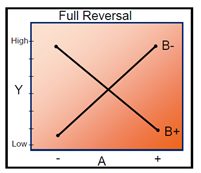
- Parallel lines: No interaction occurs.
- Nonparallel lines: An interaction occurs. The more nonparallel the lines are, the greater the strength of the interaction.
Examples of different interactions:
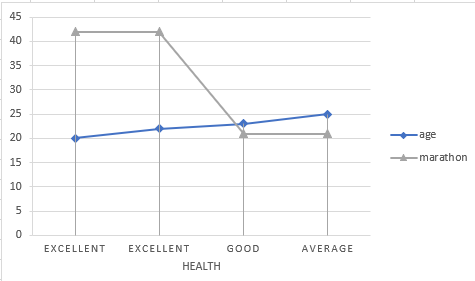
Real-time example - Running a Marathon:
If we want to plan to run a marathon within next one year we need to understand dependent and independent variables like age, shoe type, speed, wind, stamina, cardio strength, nutrition, weight, practice hours, coach, method, location and so on. This kind of effect is called the main effects. It will be less significant to assess only the main effects, by adjusting all these variables in a proper manner we can get the desired response that is completing a marathon run within the expected time.
Marathon running example. only representation On an interaction plot, parallel lines indicate that there is no interaction effect while different slopes suggest that interaction might be present.

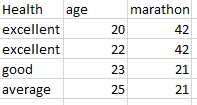
Sample data
 As you can see, the interaction plots are very significant in the field of statistics and data analytics. There are many tools available which will be used to understand the interactions. Tools used plot interactions based on the variables and responses are Minitab, IBM SPSS, Microsoft Excel and others.