
The analysis and classification of ordinal categorical data are central in most scientific domains and ubiquitous in governments and businesses.
Examples of ordinal data are either found in questionnaires for measuring opinions or self-reported health status. A well-known example of ordinal data is the Likert Scale [1]
(DISLIKE = 1, DISLIKE SOMEWHAT = 2, NEUTRAL = 3, LIKE SOME WHAT = 4, LIKE = 5).
Other examples are age measured in years (0-20, 21-40, 41-60, 61-80, above 80), body mass index (BMI) measured as (< 18.5, 18.5 – 24.9, 25 – 29, >= 30) for (underweight, normal weight, overweight, obese) or income categories and socioeconomic indices grouped in quantiles (e.g quintiles or deciles).
“In all cases, ordinal scales result when inherently continuous variables are measured or summarized by analysts by collapsing the possible values into a set of categories”[2]
A particular difficulty in dealing with distributions of ordinal data is to specify the concept of dispersion and to define a measure that has adequate properties. Recently, researchers have acknowledged this problem and addresses the issue of measuring the dispersion of ordinal data based on frequency distribution [3].
Following this approach, we introduce an easy to use statistical framework for the identification and classification of homogeneous distributions. We propose an Homogeneity and Location Index to measure the concentration and central value of an ordinal categorical distribution. We also provide a transparent set of criteria that a user can follow to establish if a given Homogeneity’s value indicates a “high” or “low” concentration of values around the central value of a distribution.
We applied our framework to assess the socioeconomic homogeneity of the commonly used SA3 Australian Census Geography.
Figure 1: Conceptual framework for the classification of homogeneous areas. Source A Framework for the classification and identification of homogeneous socioeconomic areas in the analysis of health care variation.
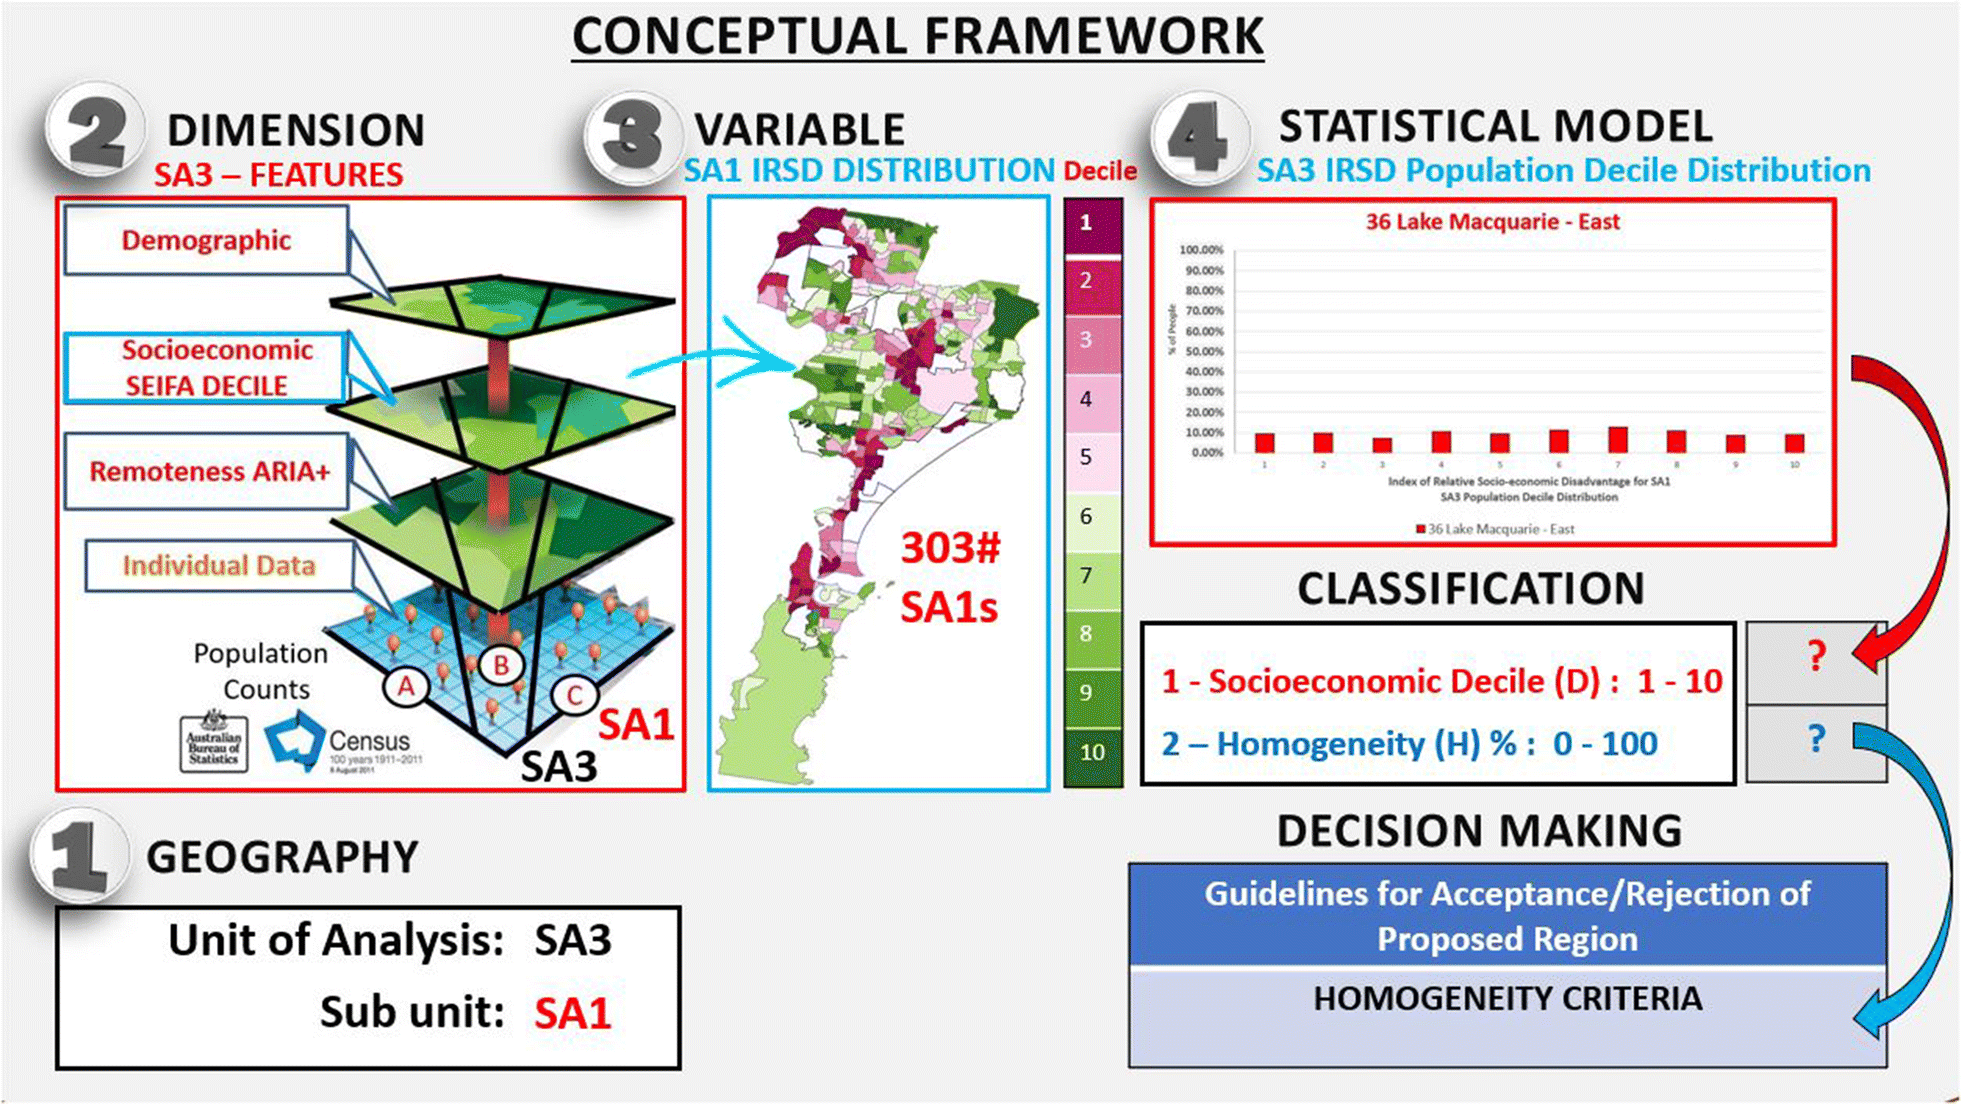
In Fig. 1, we illustrate the proposed conceptual framework that could be useful for the evaluation of homogeneous areas in health geographic studies. The first decision is the selection of the larger geographic area (e.g. SA3) and its subunits (e.g. SA1: A smaller ABS geography). Then, the contextual dimension along which one wishes to measure the homogeneity of the geographic area must be defined (e.g. SEIFA, Socio-Economic Indexes for Areas). Third, the selection of the variable used in the model must be specified since measuring the homogeneity among multiple unordered or multiple ordered categories of a variable needs a different set of measurement tools (e.g. IRSD decile). Finally, the selection of the statistical model used to represent the distributional characteristics of the area. We are interested in measuring and operationalising the distribution of a categorical ordinal variable such as the proportion of people in each decile category of the IRSD.
This set of analyses uses SA3s to assess the homogeneity of a geographic area. However, the approach can be used to evaluate the socioeconomic homogeneity across any specified geographical boundaries. It is important to notice that the methodology does not require access to fine geographic scale data, and it is easily applied to any distribution of a categorical ordinal variable. Therefore, it requires only the distribution of the attributes for the larger area.
Our approach is founded on the general theory of probability distributions, and our aim is to provide a natural benchmark for a homogeneity measure in terms of what is a “high” (i.e. homogeneous) and “low” (i.e. heterogeneous) concentration of a probability distribution. Currently, there is no accepted benchmark that could be used to assess the homogeneity of a categorical ordinal variable. In this work, we show how the proposed statistical indices can be used to investigate the diversity of a geographic area and determine when the unit of analysis should not be used for reporting health outcomes by socioeconomic status.
The R code and data sets are available on my GitHub account: homogeneity-location-index
The scripts also include statistical utilities to compute:
- convolution
- autocorrelation
- Gini Index
I hope my work could be beneficial to any organisation or scientific community involved in classification problems.