
What is t-SNE?

- It is a Data Visualization Technique
- t-SNE stands for t-stochastic neighbor embedding
- Developed by Laurens van der Maaten and Geoffrey Hinton in 2008.
- It is a variation to SNE (Stochastic Neighbor Embedding – Hinton and Roweis, 2002)
Introduction:-
Just assume you have 10 Red and 10 black ball and you want to know if there is any existing pattern in the data. either you can look at the excel file or you can visualize it which is intuitive.
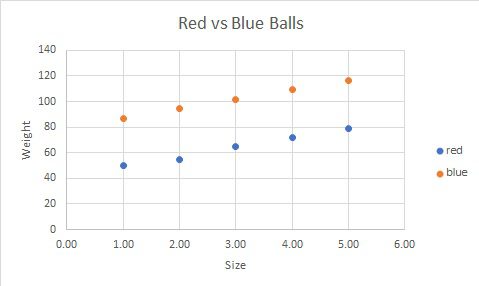
One can easily decipher that red balls are usually heavier and larger than blue balls. What if we have more than 2 features, not just height or weight rather Avg. velocity, life, price, and many more.
It will become really hard to visualize it in 2-D graph, either you will select only 2 feature or you need to come up with techniques which can help you see multi-dimensional data in 2 dimensions.
there are many such techniques like PCA, LDA, word2vec and many more
but what’s so cool about t-SNE?
Well sometimes, Data is not linearly separable i.e. you can’t draw single line between classes and say it is a clear distinction between the classes. in such scenarios we need some more evidence which can help us in proving our point,
t-SNE stands for t-stochastic neighbor embedding: –
T-distribution: – t-SNE employs a heavy-tailed distribution in the low-dimensional space to alleviate both the crowding problem and the optimization problems of SNE
Stochastic – it uses a symmetrized version of the SNE cost function with simpler gradients
Neighbor Embedding – Conditional probability is calculated in higher and lower dimensions in order to pair most similar neighbors.
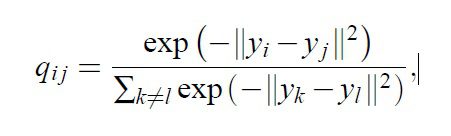
Low-Dimensional Map qij is given by :-
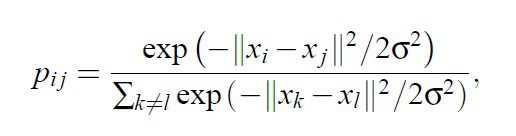
Higher Dimensional Map pij is given by:-
Following figure shows the visualization of 6000 handwritten digits from the MNIST dataset.
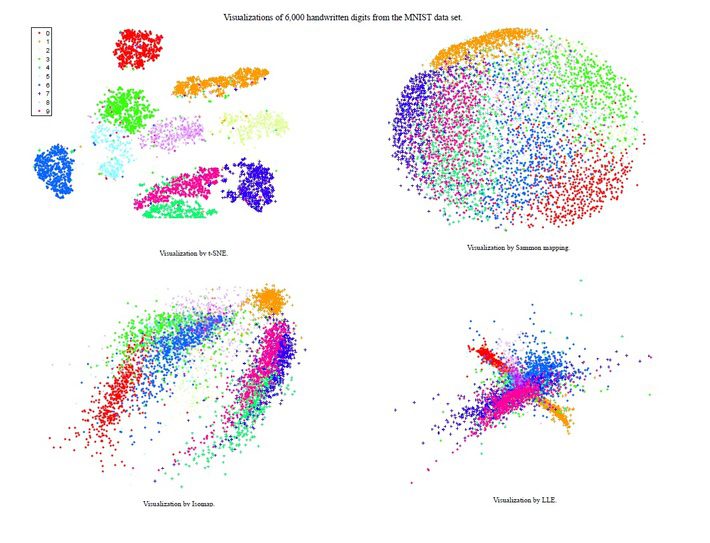
It can easily be seen that t-SNE was able to capture the pattern among different classes/digits whereas may other techniques struggled to even identify the local structure.
Reference/s:-
Visualizing Data using t-SNE by Laurens van der Maaten & Geoffrey Hinton