
For a person being from a non-statistical background the most confusing aspect of statistics, are always the fundamental statistical tests, and when to use which. This blog post is an attempt to mark out the difference between the most common tests, the use of null value hypothesis in these tests and outlining the conditions under which a particular test should be used.
Null Hypothesis and Testing
Before we venture on the difference between different tests, we need to formulate a clear understanding of what a null hypothesis is. A null hypothesis, proposes that no significant difference exists in a set of given observations. For the purpose of these tests in general
Null: Given two sample means are equal
Alternate: Given two sample means are not equal
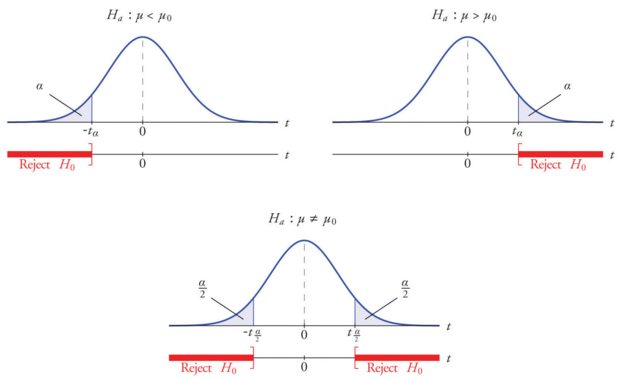
For rejecting a null hypothesis, a test statistic is calculated. This test-statistic is then compared with a critical value and if it is found to be greater than the critical value the hypothesis is rejected. “In the theoretical underpinnings, hypothesis tests are based on the notion of critical regions: the null hypothesis is rejected if the test statistic falls in the critical region. The critical values are the boundaries of the critical region. If the test is one-sided (like a χ2 test or a one-sided t-test) then there will be just one critical value, but in other cases (like a two-sided t-test) there will be two”.[1]
Critical Value
A critical value is a point (or points) on the scale of the test statistic beyond which we reject the null hypothesis, and, is derived from the level of significance α of the test. Critical value can tell us, what is the probability of two sample means belonging to the same distribution. Higher, the critical value means lower the probability of two samples belonging to same distribution. The general critical value for a two-tailed test is 1.96, which is based on the fact that 95% of the area of a normal distribution is within 1.96 standard deviations of the mean.
Critical values can be used to do hypothesis testing in following way
1. Calculate test statistic
2. Calculate critical values based on significance level alpha
3. Compare test statistic with critical values.
If the test statistic is lower than the critical value, accept the hypothesis or else reject the hypothesis. For checking out how to calculate a critical value in detail please do check
Before we move forward with different statistical tests it is imperative to understand the difference between a sample and a population.
In statistics “population” refers to the total set of observations that can be made. For eg, if we want to calculate average height of humans present on the earth, “population” will be the “total number of people actually present on the earth”.
A sample, on the other hand, is a set of data collected/selected from a pre-defined procedure. For our example above, it will be a small group of people selected randomly from some parts of the earth.
To draw inferences from a sample by validating a hypothesis it is necessary that the sample is random.
For instance, in our example above if we select people randomly from all regions(Asia, America, Europe, Africa etc.)on earth, our estimate will be close to the actual estimate and can be assumed as a sample mean, whereas if we make selection let’s say only from the United States, then our average height estimate will not be accurate but would only represent the data of a particular region (United States). Such a sample is then called a biased sample and is not a representative of “population”.
Another important aspect to understand in statistics is “distribution”. When “population” is infinitely large it is improbable to validate any hypothesis by calculating the mean value or test parameters on the entire population. In such cases, a population is assumed to be of some type of a distribution.
The most common forms of distributions are Binomial, Poisson and Discrete. However, there are many other types which are mentioned in detail at
discrete values or whether the data is continuous; whether a new pharmaceutical drug gets FDA approval or not is a…people.stern.nyu.edu
The determination of distribution type is necessary to determine the critical value and test to be chosen to validate any hypothesis
Now, when we are clear on population, sample, and distribution we can move forward to understand different kinds of test and the distribution types for which they are used.
Relationship between p-value, critical value and test statistic
As we know critical value is a point beyond which we reject the null hypothesis. P-value on the other hand is defined as the probability to the right of respective statistic (Z, T or chi). The benefit of using p-value is that it calculates a probability estimate, we can test at any desired level of significance by comparing this probability directly with the significance level.
For e.g., assume Z-value for a particular experiment comes out to be 1.67 which is greater than the critical value at 5% which is 1.64. Now to check for a different significance level of 1% a new critical value is to be calculated.
However, if we calculate p-value for 1.67 it comes to be 0.047. We can use this p-value to reject the hypothesis at 5% significance level since 0.047 < 0.05. But with a more stringent significance level of 1% the hypothesis will be accepted since 0.047 > 0.01. Important point to note here is that there is no double calculation required.
Z-test
In a z-test, the sample is assumed to be normally distributed. A z-score is calculated with population parameters such as “population mean” and “population standard deviation” and is used to validate a hypothesis that the sample drawn belongs to the same population.
Null: Sample mean is same as the population mean
Alternate: Sample mean is not same as the population mean
The statistics used for this hypothesis testing is called z-statistic, the score for which is calculated as
z = (x — μ) / (σ / √n), where
x= sample mean
μ = population mean
σ / √n = population standard deviation
If the test statistic is lower than the critical value, accept the hypothesis or else reject the hypothesis
T-test
A t-test is used to compare the mean of two given samples. Like a z-test, a t-test also assumes a normal distribution of the sample. A t-test is used when the population parameters (mean and standard deviation) are not known.
There are three versions of t-test
1. Independent samples t-test which compares mean for two groups
2. Paired sample t-test which compares means from the same group at different times
3. One sample t-test which tests the mean of a single group against a known mean.
The statistic for this hypothesis testing is called t-statistic, the score for which is calculated as
t = (x1 — x2) / (σ / √n1 + σ / √n2), where
x1 = mean of sample 1
x2 = mean of sample 2
n1 = size of sample 1
n2 = size of sample 2
There are multiple variations of t-test which are explained in detail here
Contents: The t test (also called Student’s T Test) compares two averages ( means) and tells you if they are different…www.statisticshowto.com
ANOVA
ANOVA, also known as analysis of variance, is used to compare multiple (three or more) samples with a single test. There are 2 major flavors of ANOVA
1. One-way ANOVA: It is used to compare the difference between the three or more samples/groups of a single independent variable.
2. MANOVA: MANOVA allows us to test the effect of one or more independent variable on two or more dependent variables. In addition, MANOVA can also detect the difference in co-relation between dependent variables given the groups of independent variables.
The hypothesis being tested in ANOVA is
Null: All pairs of samples are same i.e. all sample means are equal
Alternate: At least one pair of samples is significantly different
The statistics used to measure the significance, in this case, is called F-statistics. The F value is calculated using the formula
F= ((SSE1 — SSE2)/m)/ SSE2/n-k, where
SSE = residual sum of squares
m = number of restrictions
k = number of independent variables
There are multiple tools available such as SPSS, R packages, Excel etc. to carry out ANOVA on a given sample.
Chi-Square Test
Chi-square test is used to compare categorical variables. There are two type of chi-square test
1. Goodness of fit test, which determines if a sample matches the population.
2. A chi-square fit test for two independent variables is used to compare two variables in a contingency table to check if the data fits.
a. A small chi-square value means that data fits
b. A high chi-square value means that data doesn’t fit.
The hypothesis being tested for chi-square is
Null: Variable A and Variable B are independent
Alternate: Variable A and Variable B are not independent.
The statistic used to measure significance, in this case, is called chi-square statistic. The formula used for calculating the statistic is
Χ2 = Σ [ (Or,c — Er,c)2 / Er,c ] where
Or,c = observed frequency count at level r of Variable A and level c of Variable B
Er,c = expected frequency count at level r of Variable A and level c of Variable B
Note: As one can see from the above examples, in all the tests a statistic is being compared with a critical value to accept or reject a hypothesis. However, the statistic and way to calculate it differ depending on the type of variable, the number of samples being analyzed and if the population parameters are known. Thus depending upon such factors a suitable test and null hypothesis is chosen.
This is the most important point which I have noted, in my efforts to learn about these tests and find it instrumental in my understanding of these basic statistical concepts.
Disclaimer
This post focuses heavily on normally distributed data. Z-test and t-test can be used for data which is non-normally distributed as well if the sample size is greater than 20, however there are other preferable methods to use in such a situation. Please visit http://www.statisticshowto.com/probability-and-statistics/non-normal-distributions/ for more info on tests for non normal distributions.
Reference
- https://math.stackexchange.com/questions/281940/what-is-a-critical-…
- http://www.statisticshowto.com/probability-and-statistics/t-test/
2. http://blog.minitab.com/blog/adventures-in-statistics-2/understandi…
3. http://www.statisticshowto.com/p-value/
4. http://www.statisticshowto.com/probability-and-statistics/chi-square/
5. http://stattrek.com/chi-square-test/independence.aspx?Tutorial=AP
6. https://www.investopedia.com/terms/n/null_hypothesis.asp
7. https://math.stackexchange.com/questions/1732178/help-understanding…
If you enjoyed this piece please feel free to follow me on Medium or find me on LinkedIn.