
Knowing when and how to choose the right statistical hypothesis test is no mean feat. It can takes years of learning and practice before you get comfortable with it.
Fortunately, there are ways to shortcut this by having a process, a strategy and a nice, big diagram!
Here I’m going to give you all three!
Getting Started
I think everyone responds well to a good visualisation, so that’s where we’re going to start.
I’ve created what I call The Hypothesis Wheel, and here it is making its debut in the world:
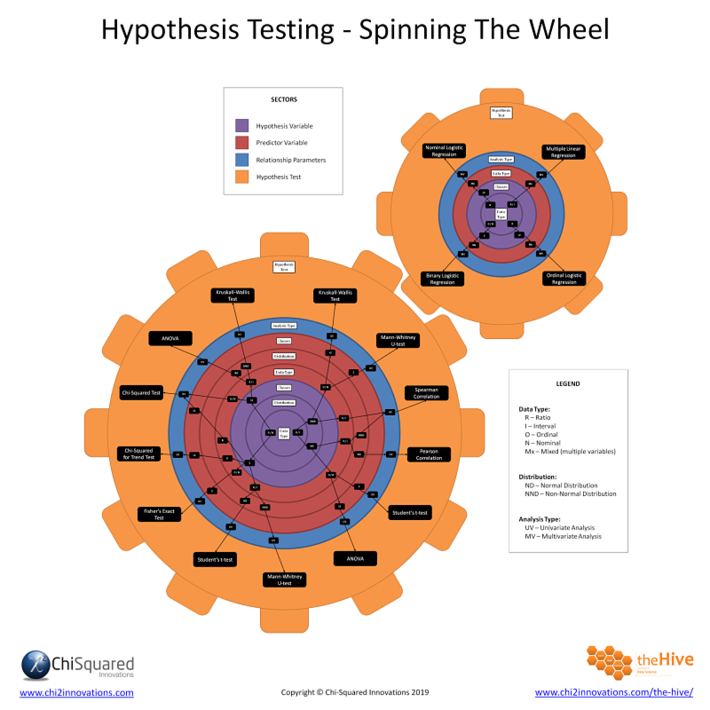
Now, there’s a HUGE amount of information in there, and I don’t expect anyone to absorb it all with just a quick glance, so it will take you quite a bit of study time to get to grips with it all.
Hypothesis Testing – a 4 Step Strategy
When making decisions about which hypothesis test to select, you need a plan of action, and here’s my 4 step strategy:
- Deduce the properties of your outcome variable (aka dependent or hypothesis variable)
- Deduce the properties of your input variable (aka independent or predictor variable)
- Deduce the parameters of the relationship
- Look up the statistic on the Hypothesis Wheel
Steps 1 & 2: Your Variable Properties
As steps 1 and 2 are the same thing, you can do them together. The properties you need to check for your input and outcome variables are:
- Data Type
- Distribution
- Number of Classes
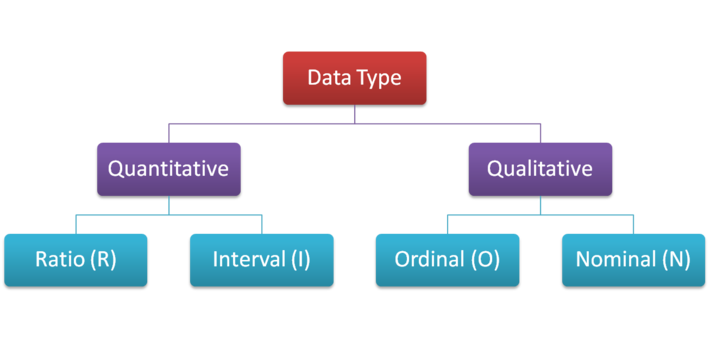
There are 4 distinct data types that you’ll come across in your research, and they are Ratio (R), Interval (I), Ordinal (O) and Nominal (N), like this:
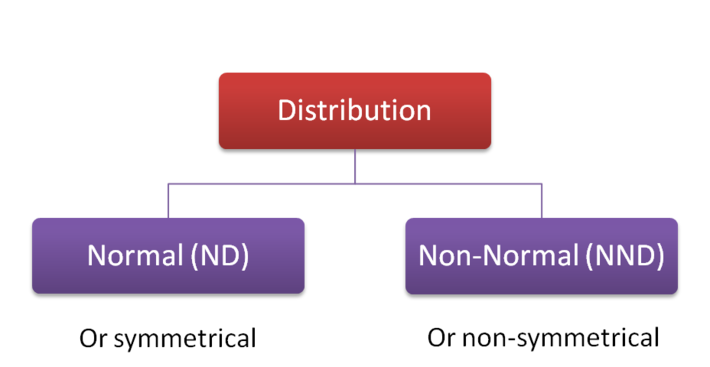
In terms of the distribution you need to check whether your data (Ratio or Interval data only) are normally-distributed (ND) or non-normally distributed (NND). Actually, all you really need to know is whether they are symmetrical or not – they don’t actually need to be full-blown Gaussian distributions to qualify here.
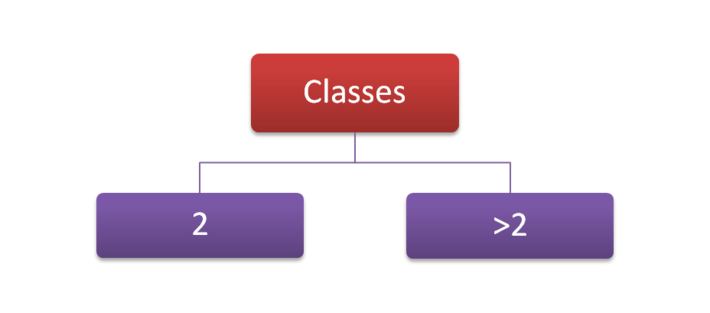
Finally, you need to check (Ordinal or Nominal only) how many classes (categories) there are in your data. It’s easier to explain what that means by example – the variable Gender has 2 classes; Male and Female, whereas Colour Of The Rainbow has 7 (ROYGBIV). What you really need to know is whether your variable has 2 classes or more than 2.
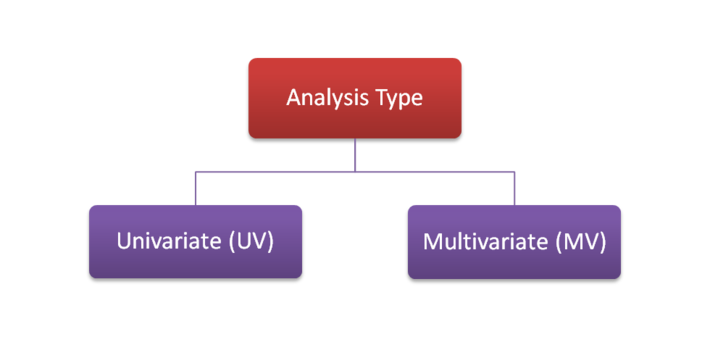
Step 3: Relationship Parameters
The relationship parameter you need to know for the Hypothesis Wheel is which type of analysis are you conducting, univariate or multivariate, like this:
Hypothesis Wheel Colour Codes
To help you navigate around the hypothesis wheel I’ve colour coded various parts of it, like this:
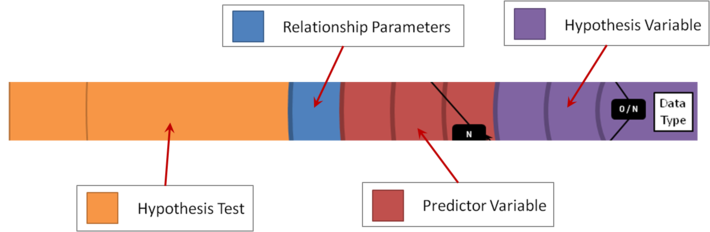
Step 4: Look up Your Statistic on the Hypothesis Wheel
We always start in the centre with the properties of the hypothesis variable, coloured in purple. There are 3 concentric circles corresponding to Data Type, Distribution and Number of Classes.
Spinning further out, in red we have the properties of the predictor variable – again, there are 3 circles for Data Type, Distribution and Number of Classes.
Then we have a blue circle for the relationship parameters, which denotes whether our analysis is univariate (UV) or multivariate (MV). When you look closely you’ll see that there are 2 hypothesis wheels, and the larger one contains only univariate hypothesis tests while the smaller one has only the multivariate hypothesis tests.
Finally, the outer orange circle tells us which hypothesis test we should choose in any given circumstance.
Hypothesis Wheel Example
Let’s zoom in on a particular example to see how you would use the hypothesis wheel to tell you which univariate test you should use.
Let’s say that your hypothesis variable has the following properties:
- Ordinal
- >2 classes
And your predictor variable has these properties:
- Nominal
- >2 classes
Now let’s see what that looks like on the hypothesis wheel:
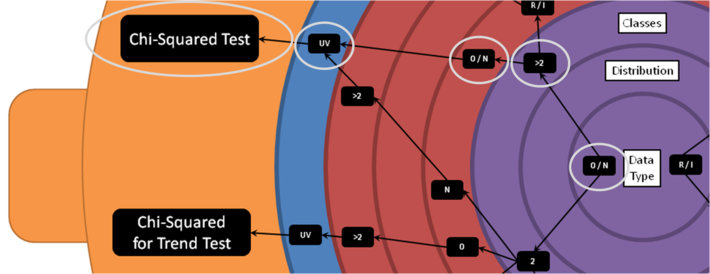
Starting from the centre, locate the data type of your hypothesis variable (Ordinal). It has more than 2 classes, so we locate that too. Spinning out to the red segment, locate the data type of your predictor variable (Nominal). In this case, since the hypothesis variable has more than 2 classes it doesn’t matter how many classes the predictor variable has – the correct statistic is the Chi-Squared Test.
Summary
The Hypothesis Wheel is more than just another flow chart that helps you choose which statistical hypothesis test you should use. The world doesn’t need another flow chart, it needs a better one – and I believe this is it.
The Hypothesis Wheel is a framework for helping you to ask the right questions of your data so you can get the correct answers. All you need to do is ask 3 questions to correctly select your hypothesis test:
- What are my data types (RION)?
- What are their distributions (ND, NND), and/or how many categories do they have (2, >2)?
- What types of analysis am I looking to perform (UV, MV)?
Once you’ve answered these questions – and they are right there on the chart to help you decide – the Hypothesis Wheel will help you choose the correct statistical tool to use.
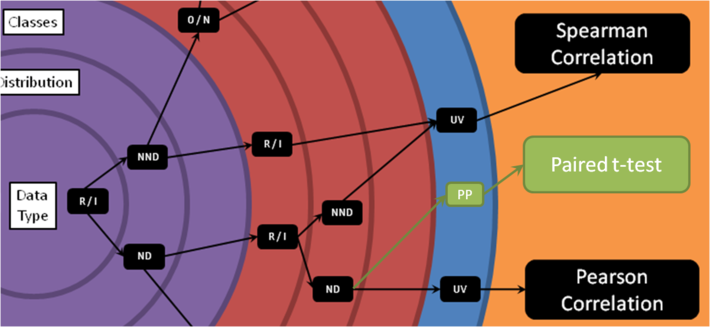
But this isn’t why it is a framework. It is a framework because if there is a statistical test that is not present on the chart (I’ve only included the most used hypothesis tests), it is really easy to see exactly where it should fit on the Hypothesis Wheel, like this:
Hypothesis Wheel – Free Download
If you want your very own hypothesis wheel to download and keep, you can get a high definition pdf right here.
Intuitive resources and very helpful indeed.