
This article was written by Jim Frost.
The standard error of the regression (S) and R-squared are two key goodness-of-fit measures for regression analysis. While R-squared is the most well-known amongst the goodness-of-fit statistics, I think it is a bit over-hyped.
In this post, I’ll compare these two statistics. We’ll also work through a regression example to help make the comparison. I think you’ll see that the oft overlooked standard error of the regression can tell you things that the high and mighty R-squared simply can’t. At the very least, you’ll find that the standard error of the regression is a great tool to add to your statistical toolkit!
Comparison of R-squared to the Standard Error of the Regression (S)

As R-squared increases and S decreases, the data points move closer to the line
You can find the standard error of the regression, also known as the standard error of the estimate, near R-squared in the goodness-of-fit section of most statistical output. Both of these measures give you a numeric assessment of how well a model fits the sample data. However, there are differences between the two statistics.
- The standard error of the regression provides the absolute measure of the typical distance that the data points fall from the regression line. S is in the units of the dependent variable.
- R-squared provides the relative measure of the percentage of the dependent variable variance that the model explains. R-squared can range from 0 to 100%.
An analogy makes the difference very clear. Suppose we’re talking about how fast a car is traveling.
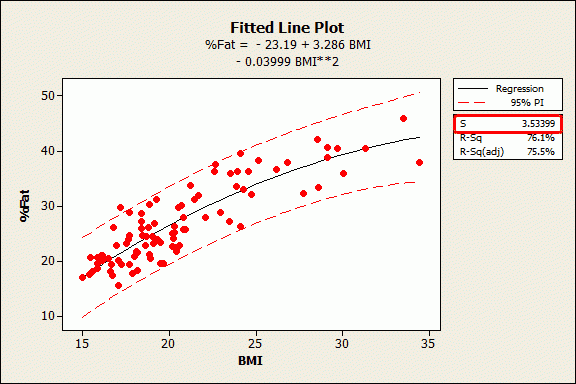
Example Regression Model: BMI and Body Fat Percentage
R-squared is equivalent to saying that the car went 80% faster. That sounds a lot faster! However, it makes a huge difference whether the initial speed was 20 MPH or 90 MPH. The increased velocity based on the percentage can be either 16 MPH or 72 MPH, respectively. One is lame, and the other is very impressive. If you need to know exactly how much faster, the relative measure just isn’t going to tell you.
The standard error of the regression is equivalent to telling you directly how many MPH faster the car is traveling. The car went 72 MPH faster. Now that’s impressive!
Let’s move on to how we can use these two goodness-of-fits measures in regression analysis.
To read the full original article click here. For more regression and R-squared related articles on DSC click on the links.
DSC Resources
- Services: Hire a Data Scientist | Search DSC | Classifieds | Find a Job
- Contributors: Post a Blog | Ask a Question
- Follow us: @DataScienceCtrl | @AnalyticBridge
Popular Articles