
The images on this blog are from an algorithmic environment that I first developed about 15 years ago – rendered using a graphical system that I wrote in Java. A “differential lattice” is a structured array of differences between two points: e.g. the difference between the closing price of a stock on day T-0 (today) and T-6 (a week ago). Consequently, if the closing prices are $10.10, $10.20, $10.30, $10.40, and $10.50 (today), then 0/3 is from T-0/T-3 or $10.50 less $10.20 = $0.30. A sequenced lattice might be 0/1, 0/2, 0/3, 0/4, 0/5, 0/6, 1/1, 1/2, 1/3, 1/4, 1/5, 1/6 and so forth. I present three snapshots of a differential lattice containing data from the closing prices of Yahoo! around the summer of 1998. I call the lattice Half Note. Streaming closing price for Yahoo! for the sampling period creates a fluid or convective flow from the top to the bottom of Half Note; also, the elliptical rings appear to spin.
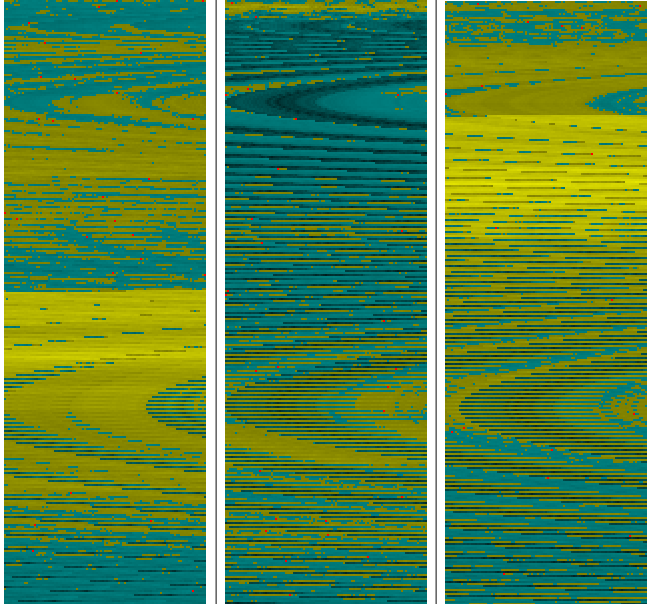
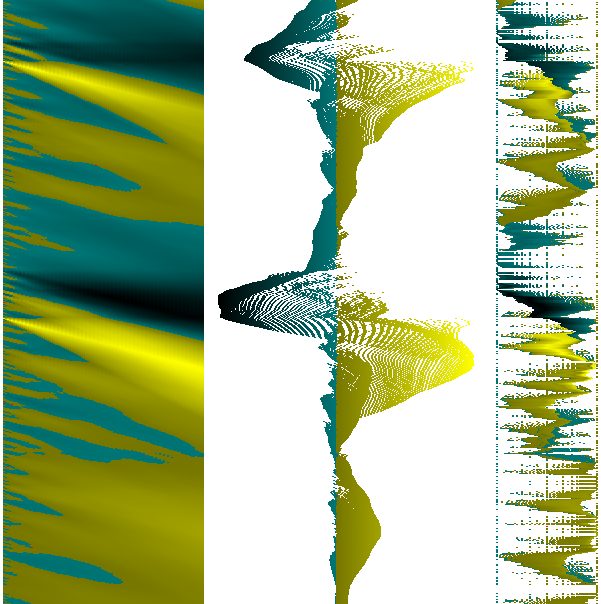
The closing price for Yahoo! as is the case for most stocks is convective. The prices tend to gradually move like fluid with points of expansion, compression, tempo, and tempo robatto. The price isn’t $1 one day and $100 the next day. Below I show the resulting patterns once again from Yahoo! Conceptually, Half Note contains all possible differentials. However, “all possible” would be quite impossible in real life – there being an infinite number of possibilities. It would be fairer to say that Half Note contains an exceptionally large number of differentials. The plume image on the left is from a short “strand” of the Half Note lattice. As time passes, the strand weaves a watery pattern. The middle image is the same as the plume on the left except from top to bottom rather than left to right. I call the right image a displacement plume. It forces a kinetic derivative of the plume to fit in a bounded area between -1 and +1.
Randomness
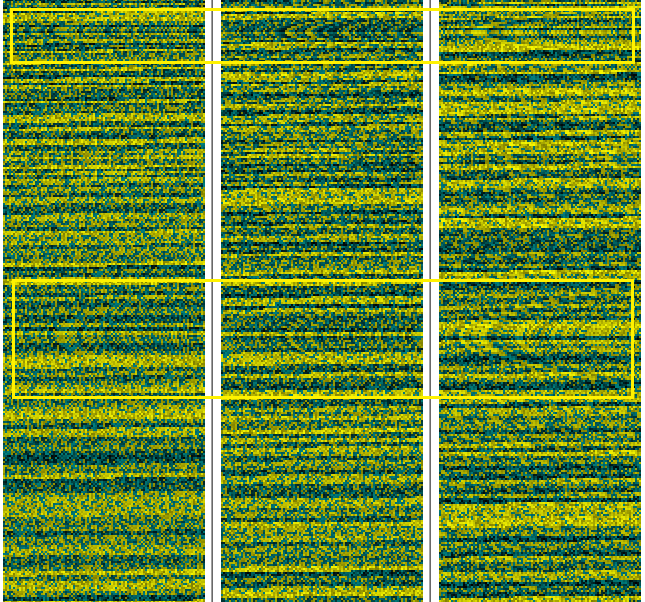
A differential lattice or even just a strand of it can create quite an interesting portrayal of reality. It entered my mind one evening, what would I get from Half Note if I generated a long stream of random numbers (e.g. from 0 to 99,999)? The resulting images are shown below again using three snapshots. I hope that readers notice that certain residuals of the arches remain present. Refer to the yellow boxes for the arch locations. Given that the stream of numbers is indeed random, the resulting lattices and plumes provide a useful reference against which to compare data that isn’t clearly random.
From a graphical standpoint, the differential pattern resembles rough muddy terrain (below left); its cross-section resembles a tight rope with sharp flourishes (below middle); and the displacement pattern easily fits within the bounded area while being choppy indicating lack of preference or momentum (below right).
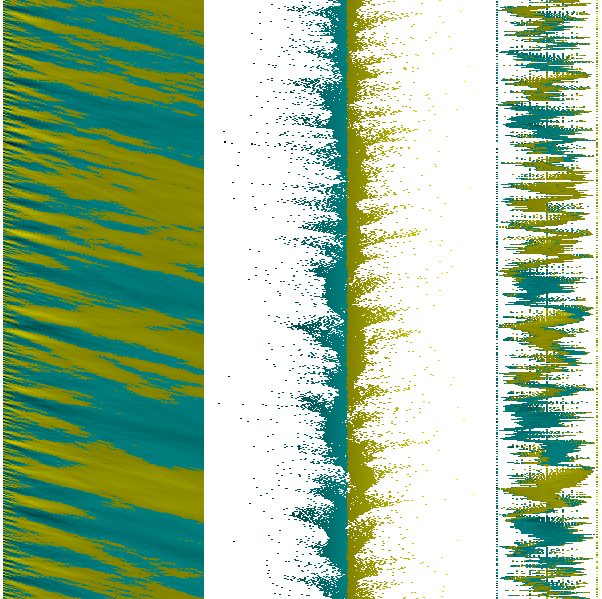
The next image is taken from what I call the “ambient flux” of earthquake data from Western Canada, again using three snapshots taken at random. I would post the entire clip if it were possible. On my software, the Half Note imaging is in motion. Since the lattice doesn’t appear particularly random – now that we can compare it to a truly random sample – I suggest that perhaps this is because it isn’t random. Nonetheless, I don’t claim to have any expertise on earthquakes. I’m just saying the results appear to be much less random than a stream of random numbers from 0 to 99,999.
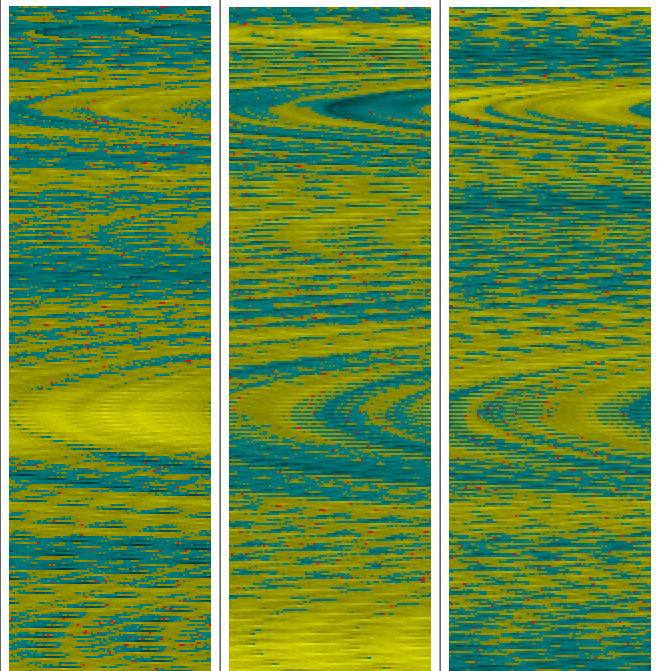
This has been a short overview of using a sequenced differential lattices to examine data randomness. Experiments suggest to me that it is difficult to suppress the Half Note arches; that mathematical randomness is quite difficult to observe in real data. However, even if mathematical randomness is achieved, the plume images indicate that randomness need not be studied in mono-dimensional terms. The “character” of the randomness can be examined graphically. Not only this, but by studying the similarities in patterns between different data sources, it might be possible to infer from the data the underlying kinetic attributes.