
We are dealing with plethora of data and information in the world today and expectation is to predict and forecast how we can gain competitive advantage based on the information that we have, to act in advance. We look forward to define and furnish various methods based on our gut feel, past historical data, simple mathematical averages, and many more to get an incredibly precise prediction. With advanced analytics and data science, we develop “always-on” forecasting models which enable our clients to take their decisions effectively. From intuition to traditional algorithms to machine learning, phases have been evolving over a period.
Key processes that we follow while using forecasting can be outlined as per below:
- Defining the goal or business objective
- Getting the required data
- Explore and visualize series
- Pre-processing of the data
- Partitioning the series
- Applying suitable forecasting methods
- Evaluate and compare performance
- Implement forecasts / system
Processes 2 & 3 are iterative and 6 & 7 are iterative.
We try to look for answers to various questions in the process – is the goal / business objective descriptive or predictive in nature? What is the forecast horizon (how far into the future, rolling forward or at a single time point, one time forecasting or ongoing task)? How will forecast(s) be used (who are stakeholders, whether it’s a numerical or event forecast, what is the cost of over-prediction or under-prediction, will forecasts undergo “adjustments”)? What is the forecasting expertise and automation needed to accomplish the goal? etc.
When it comes to data, the quality of data, sample, temporal frequency, balance between signal & noise, series granularity, domain expertise is quintessential. There are many methods that can be used to forecast. Which are relevant to our situation depends upon our objectives and conditions we face. Often, there is no single best method. In fact it is best to use different methods and combine their forecasts.
If we talk about well-accepted methods that should be used to provide benchmark forecasts, the simplest forecasting method for time series for example is the random walk. It assumes that the future values of a time series will be equal to the current value. In other words, one does not have useful information about future changes in the series – it is equally likely to go up or down. Time series components can be categorized in multiple parts.
- Systematic part
- Level
- Trend
- Seasonal patterns
- Non-systematic part
- Noise
Additive and multiplicative models can be defined in an equation comprising of these components. i.e.
- Additive model: Y(t) = Level + Trend + Seasonality + Noise
- Multiplicative model: Y(t) = Level * Trend * Seasonality * Noise
A model which fits the data well, does not necessarily forecast well. A perfect fit can always be obtained by using a model with enough parameters. Over-fitting a model to data is as bad as failing to identify the systematic pattern in the data. Hence as a solution we look forward to data partitioning strategies where we look forward to training, validation, and future aspects. Ideally, validation period depends on the forecast horizon, seasonality, length of series, underlying conditions affecting the series etc.
Typical time series patterns can be looked at in Exhibit 1.
Exhibit 1
When we look at common predictive accuracy measures, then average error, mean absolute error (MAE), mean squared error (MSE), mean absolute percentage error (MAPE) techniques come into mind. Exhibit 2 displays how these measures are different.
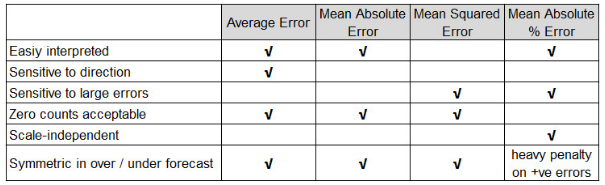
Exhibit 2
There are various forecasting methods used based on data and situation. If there is a need for one time forecasting, in-house expertise is available, smaller number of series exist, typically model based methods are used and these are typical “manual”. In the other hand, if there is ongoing forecasting, no in-house expertise available, many series to forecast etc., then typically data driven methods are used and these are “automated” and computationally fast. Exhibit 3 shows various forecasting methods which are either model based or data driven. Ensembles are often used by combining forecasts from different methods.
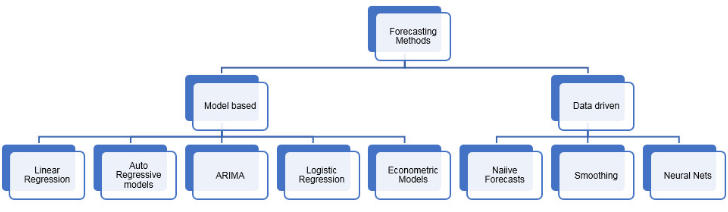
Exhibit 3
While prediction is concerned with future certainty, forecasting looks at how hidden currents in the present signal changes in direction. Objective of forecasting is to identify the full range of possibilities and not limited to set of illusory certainties. “Forecasting can probably be looked at a subset of prediction” – any time we predict into the future, it is a forecast. All forecasts are predictions, but not all predictions are forecasts, as when we would use regression to explain the relationship between two variable. So, what a forecast need? It requires a logic, an ability for quality assessment of forecasting approaches and few rules for effective forecasting. We need to be pragmatic in terms of defining it in a manner that helps decision maker or stakeholders to exercise strategic judgment, need to identify key patterns and seasonality, need to embrace those items which cannot be classified, need to look at more past or historical data to make sense as fewer data elements would not make any meaningful forecasting etc. We also need to understand when to make a combination of forecasts or forecasting methods by using ensembles and when “not to” forecast at all.
Forecasting and selecting an appropriate method for doing forecasting will always be interesting blend of “Art” and “Science” in addition to our judgement and practicality.
Disclaimer: “The postings on this site are my own from my experiences and don’t necessarily represent IBM’s positions, strategies or opinions.”