

One of the main requirements for modern information systems is the high data processing rate. Among the solutions to solve this problem the popular one is to use high-performance databases. This article will review and compare two popular databases in performance terms: Scylla and Cassandra:
- Cassandra is a distributed, scalable and secure database built on the principles of the NoSQL storage with no single point of failure assurances.
- Scylla is a drop-in Cassandra NoSQL highly available and performance database that allows implementing ultra-low latency and high throughput data processes.
These databases use the same structure, which allows for easier migration from one database to another. The main difference between them is that Scylla is written in C++ when Cassandra is in Java.
So Scylla has the following performance advantages:
- reduces CPU resources consumption by avoiding program loading into the JVM,
- has more flexible and complex memory management (attributes of C++ designed programs),
- provides a custom network configuration that minimizes resource usage with direct requests from userspace without usage system kernel.
Therefore, Scylla should, in theory, be a higher performance database than Cassandra. But theoretical results may differ from the practical ones, due to specificity of the data and the queries. So let’s perform comparison benchmarks with access to data in Scylla and Cassandra databases.
Benchmarking options
The performance benchmarking process for two databases follows the next principles:
- Using several database versions (revisions) for more efficient performance comparisons:
- Scylla version – 2.1.2 (Cassandra version 3.0.8),
- Cassandra versions – 3.0.16 and 3.11.2.
- Using the same hardware options with benchmarks tests:
- Scylla and Cassandra with 4GB of RAM,
- Linux OS (Ubuntu 16.10).
- Determining benchmarking processes:
- writing data tests,
- writing and reading data tests.
- Benchmark parameters and metrics options:
- rate parameters: operations, partitions, rows;
- latency options: mean, median, percentiles and max values;
- partitions: total value of data partitions;
- operation time: total time for all data operations.
- Using the same dataset for the correct and valid benchmark test results.
Benchmarking processes
Benchmarking processes represent an iterative procedure: cyclic execution process for pre-defined algorithms – usually the simplest ones. In our case, these algorithms include the writing and reading data procedures for each database: Scylla and Cassandra. The general benchmark processes structure is shown below.
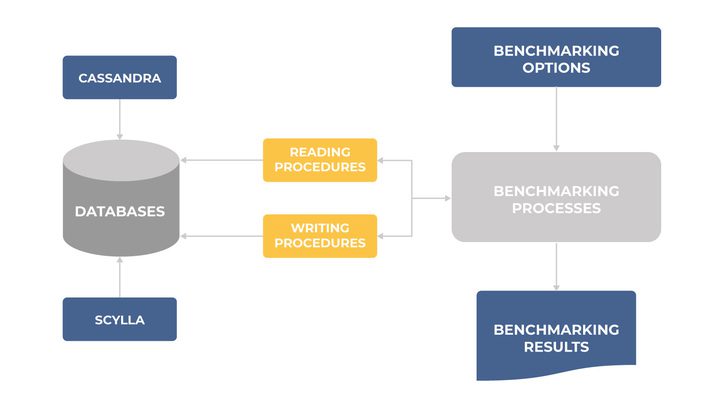
Also, it should be noted that all benchmarks data operations will be performed with the same data. The results will be presented in the tables and diagrams form for better analysis and comparison process.
Let’s leave out the technical details of the benchmarking process and just present it’s results.
Write test
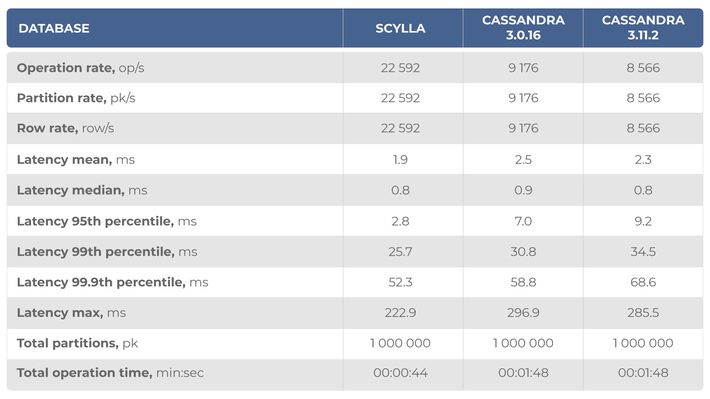
Write test includes the data writing into the database and measuring a number of parameters that describe its performance. These parameters are grouped according to the described data processes and have numerical values:
- rate parameters – describe data rates for operations, partitions, and rows;
- latency parameters – define the reaction time for database accessing process and presented in the statistical form: mean, median, quintiles;
- total parameters – show the resulting value by the number of operations and its total time.
We’ll build diagrams based on parameters that generally describe the database’s performance. Diagrams are shown as a bar plot for each group of parameters.
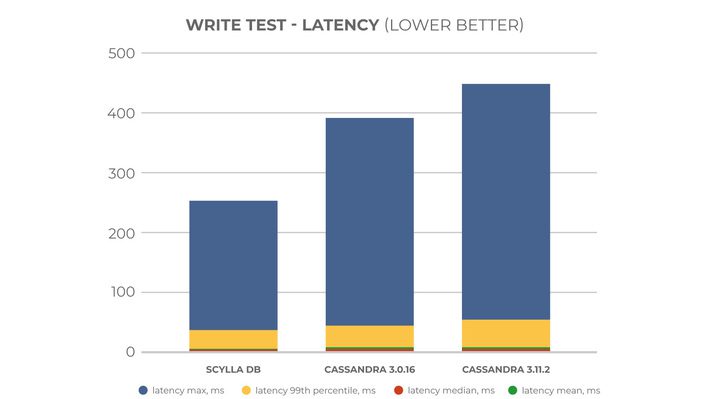
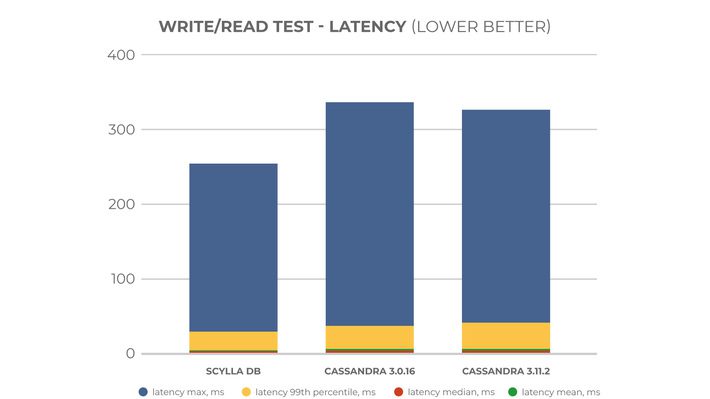
The first diagram describes the latency parameters. As we can see, the average latency values are approximately equal for all databases, but the maximum ones are higher for Cassandra. The maximum latency values are valid for a small data amount and therefore cannot generally describe the database’s performance. That means that the database’s performances are approximately the same by this parameter.
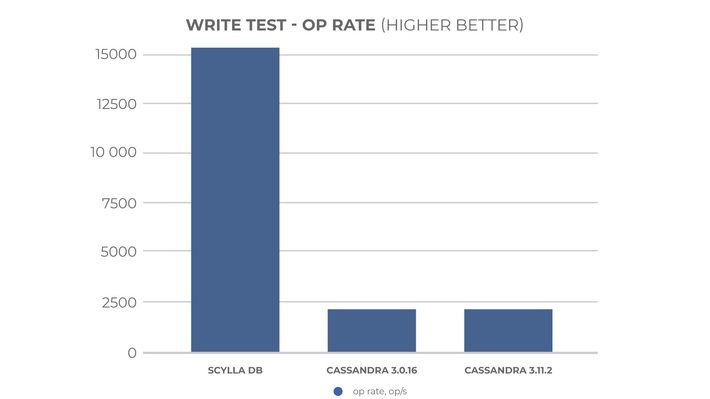
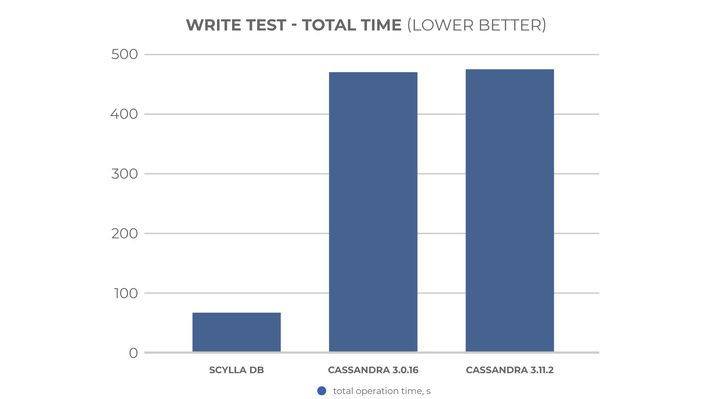
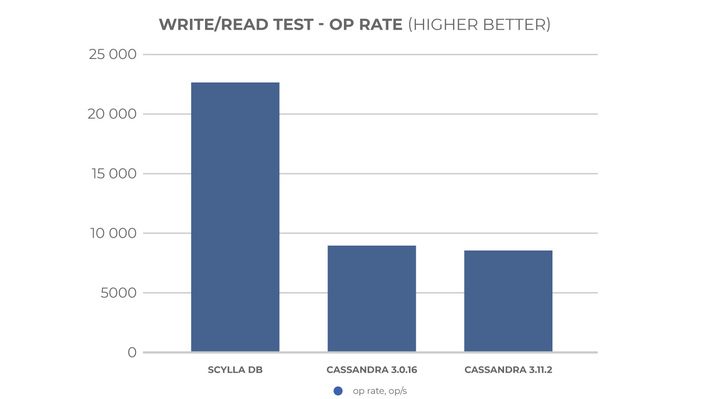
The remaining diagrams describe operation rate parameters and their total time measuring. As we can see, the performance of the Scylla database by these parameters is more than 6 times greater than that of Cassandra databases.
In general, we can conclude that the data writing performance of the Scylla database is an order of magnitude larger. For a more complete analysis of database performance, let’s perform a similar test for writing/reading data procedures.
Write/read test
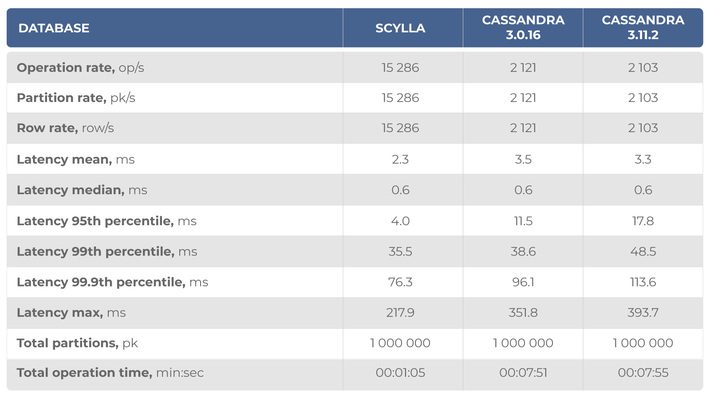
Write/read test includes all the same data processes as in the previous test. The only difference is only for simple operation of the test – it includes writing data and their following reading. For this reason, let’s present only the test results in the table and diagrams forms, and then analyze them.
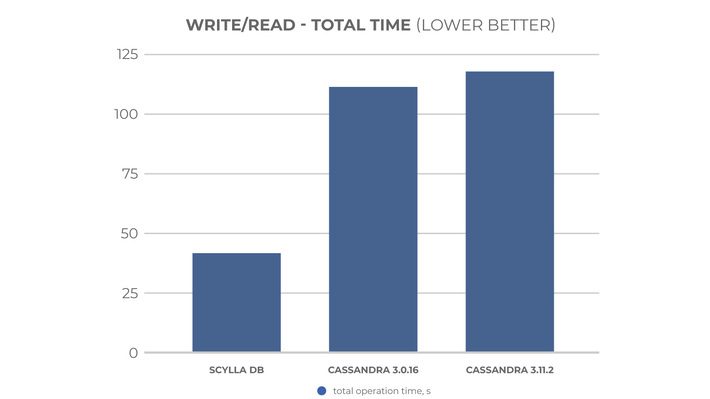
Analyzing the results we can conclude that the distribution patterns of the writing/reading test results match the previous test: latency performance is approximately the same and operation rate and total time are approximately 2.5 times higher. Therefore, we can say that the writing/reading procedures performance for the Scylla database is higher than for Cassandra.
Conclusion
In this article, we compared the performance of two popular Scylla and Cassandra databases using the benchmark processes. The tests were performed for data writing and writing/reading procedures, based on the required parameters’ groups, and showed that in general Scylla is faster than Cassandra.