
By Gunnar Carlsson
December 3, 2018
In their very provocative paper, Peter Battaglia and his colleagues, posit that in order for artificial intelligence (AI) to achieve the capabilities of human intelligence, it must be able to compute with highly structured data types, such as the ones humans deal with. This means that AI must be able to work with information about relationships between objects, which are effectively encoded as graphs, i.e. collections of nodes and edges between these nodes, and also attributes attached to the nodes and edges.
A simple example would be images, where one considers graphs which are shaped like a square grid, with the pixel values being the attribute attached to a particular node in the grid. The authors go on to describe the framework they have developed for computing with graph structured data, in particular describing how neural networks for this kind of computation can be built.
Embedded in this work is the following question:
Where do the graphs come from?
The question recognizes the fact that most data is “sensory” in character, i.e. it is obtained by measuring numerical quantities and recording their values as coordinates of vectors in a high dimensional space, and consequently do not come equipped with any explicit underlying graph structure.
It follows that in order to achieve human like intelligence in studying such data, it is necessary to construct graph or relational structures from sensory data, and also that performing such constructions is a critical ingredient in human intelligence.
The goal of this post is to describe a method for performing exactly this task, and to describe how neural networks can be constructed directly from the output of such methods. We can summarize the approach as follows.
- A key ingredient is a geometry or metric on the set of features or sensors that are capturing the sensory data.
- The second key ingredient is that of a covering of the set of features by subsets. The coverings typically are chosen to be well related to the geometry in a suitable sense.
- The geometry and related coverings are used in conjunction to construct graph structures from the features defining the data.
- They are also used to construct analogues of the pooling constructions used in convolutional neural networks, which permit the learning to be based on various levels of resolution.
The interested reader should consult the Topological Data Analysis Based Approaches to Deep Learning and Topological Approaches to Deep Learning where the constructions are discussed in detail.
We strongly agree with the point of view expressed in the DeepMind/Google paper that their work rejects the false choice between “hand-engineering” and “end-to end” approaches to learning, and instead argues for the recognition that the approaches are complementary and should be treated as such. What follows is that we should be developing a wide variety of tools and methods that enable hand-engineering of neural networks. The methods described in the DeepMind/Google paper are a step in that direction, as are papers on TDA-based Approaches to Deep Learning and Topological Approaches to Deep Learning.
We also observe that the benefits of such an approach go beyond improving the accuracy and speed of neural net computations. Once the point of view of the DeepMind/Google paper is adopted, one will be able to create algorithms which realize the idea of machine-human interaction. In particular, they will be more transparent, so that one can understand their internal functioning, and also provide more complex “human-readable” outputs, with which humans can interact. This paper on the Exposition and Interpretation of the Topology of Neural Networks constitutes a step in that direction.
Finally, we observe that in order to fully realize this vision, it is important not only to make the computation scheme human readable, but also the input data. Without a better understanding of what is in the data, the improvements described by Battaglia and his colleagues will only get us part of the way to fully actualizing artificial intelligence. Topological methods provide tools for understanding the qualitative and relational aspects of data sets, and should be used in the understanding of the algorithms which analyze them.
Graphs from geometry
In the case of images, the graph structure on the set of attributes (pixels) is that of a square grid, with some diagonal connections included.
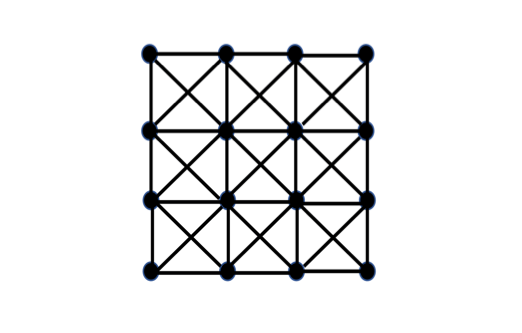
Our first observation is that the grid is actually contained in a continuous geometric object, namely the plane. The importance of the plane is that it is equipped with a notion of distance, i.e. a metric in the mathematical sense (see Reisel’s work here). The set of vertices are chosen so as to be well distributed through a square in the plane, so that every point in the square is close to one of the vertices. In addition, the connections in the graph can be inferred from the distance. This is so because if we let r denote the distance from a vertex to its nearest neighbor (this is independent of what vertex we choose because of the regularity of the layout), then two vertices are connected if their distance is < √2r.
So, the graph is determined by:
(a) a choice of subset of the plane and
(b) a notion of distance in the plane
The value of this observation is that we often have sets of attributes or features that are equipped with metrics. Some interesting examples were studied in this paper, where a study of the statistical behavior of patches in natural images was performed. One of the findings was that there is an important feature that measures the “angular preference” of a patch in the direction of a particular angle θ. As we vary θ, we get a set of features which is geometrically laid out on a circle, which can be discretized and turned into the graph on the left below. A more detailed analysis showed a two-parameter set of features that are laid out in the form of a geometric object called a Klein bottle, shown with associated graph structure on the right below.
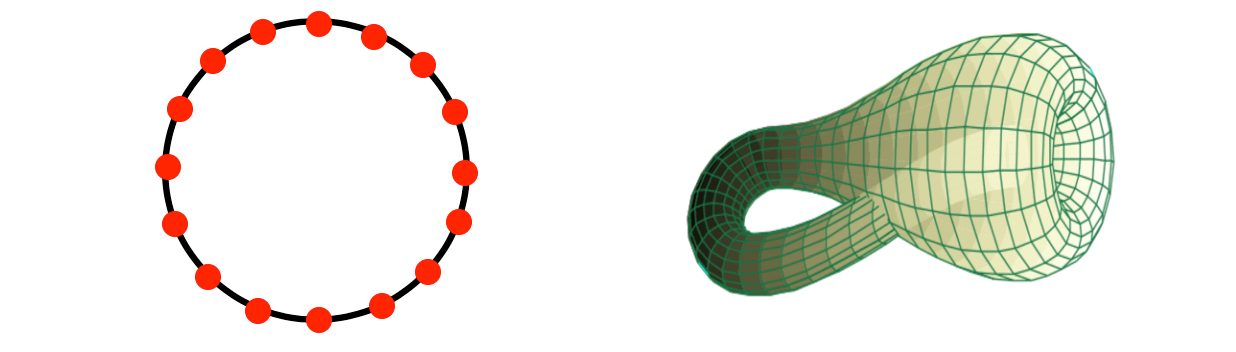
Analogous geometries can be found for 3D imaging and video imaging. The work in the Exposition paper has suggested larger spaces containing the Klein bottle which will apply to larger scale features and more abstract objects.
Purely data driven graph constructions
The constructions in the previous section rely on a prior knowledge concerning the features or a detailed data analytic study of particular sensing technologies. To have a method that is more generally applicable, without complicated data analysis, it is necessary to have methods that can quickly produce a useful graph structure on the set of features. Such a method exists, and is described in both the TDA paper as well as the Topology paper.
Suppose that we have a data matrix, where the rows are the samples or observations, and the columns are features or attributes. Then the columns are vectors, and there are various notions of distance one might equip them with, including high-dimensional Euclidean distance (perhaps applied to mean centered and normalized columns), correlation, angle, or Hamming distance if the values are Boolean. There are typically many options. By choosing a distance threshold, we can build a graph whose nodes are the individual features. If the threshold is small, the graph will be sparser than if we choose a larger threshold. So, at this point we have a method for constructing a graph from sensory data. Further, the graph describes a similarity relation between the features, in the sense that if two features are connected by an edge, we know that their distance (regarded as a dissimilarity measure) is less than some fixed threshold, and therefore that they are similar to each other.
This construction certainly makes sense and generalizes the construction that is done for images. However, it produces graphs which are large in the sense that they have the same number of nodes as we have features. They may also be dense in the sense that some nodes may have a very large number of connections, which is not ideal from the point of view of computation. We will address this problem via a form of compression of the graph structure.
To understand this construction, we will discuss another aspect of the deep learning pipeline for images, namely the pooling layers. We describe it as follows.
The “pooling” refers to pooling values of subsets of pixels, specifically smaller squares. The picture below describes the situation, where we have covered the pixel grid by nine smaller subgrids, each one two by two.
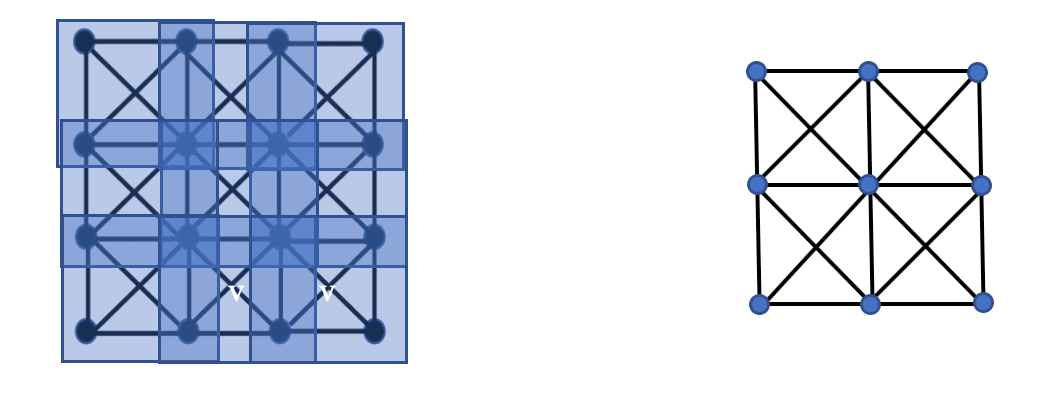
The idea of pooling is to create a new graph, this time three by three, with one node for each of the subgrids. The interesting point is that the creation of the new graph can be described in terms of the intersections of the subgrids only. Specifically, the nodes corresponding to two subgrids are connected by an edge if and only if the subgrids have at least one pixel in common. The value of this observation is that this criterion generalizes to the general situation of a geometry on the space of features, provided that we can produce a covering analogous to the covering of this square by subgrids. We refer to the collection of subgrids as a covering of the set of pixels, where by a covering of a set X we mean a family of subsets U of X so that every element of X is contained in some member of the U covering.
Topological data analysis provides a systematic way of producing such coverings, using a method referred to as Mapper, which is described in the TDA and Topology papers.
The output of this construction will be a family of graphs , ⌈1…,⌈r with the following properties.
- Each vertex in each graph corresponds to a family of features.
- The collections corresponding to vertices are small or localized in the assigned metric on the set of features.
- Each graph is low-dimensional in the sense that the number of vertices that lie in a clique is bounded above.
- The size of the sets of features corresponding to vertices grow as we move from ⌈1 to ⌈r. In other words, the graphs become coarser and coarser representations of the set of features.
The construction yields a systematic way of producing graph representations of the sensory data available from the data matrix. It turns out that one can go directly from this representation to neural network architectures.
In fact, one could even imagine incrementally producing coverings using Mapper on the activation-values of the layers following the input layer. Occasionally recomputing the coverings and therefore the graph structure would allow the network to adapt its graph structure during training.
Constructing neural networks
The circular constructions given above can give some very simple geometric constructions of neural network architectures adapted to them. For example, in the case of the circular networks described above, a picture of such a construction would look as follows.
Similar constructions are available for the Klein bottle geometries and others.
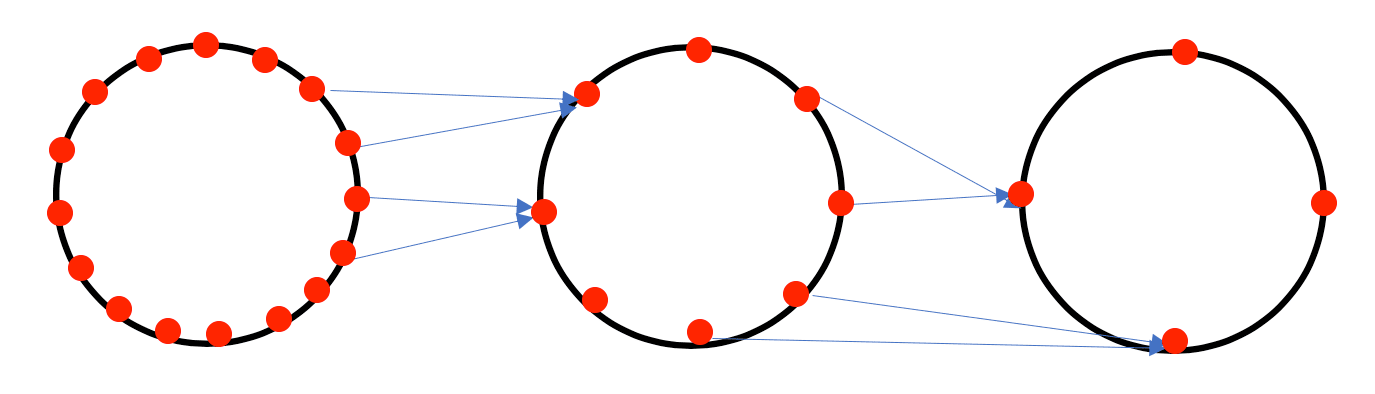
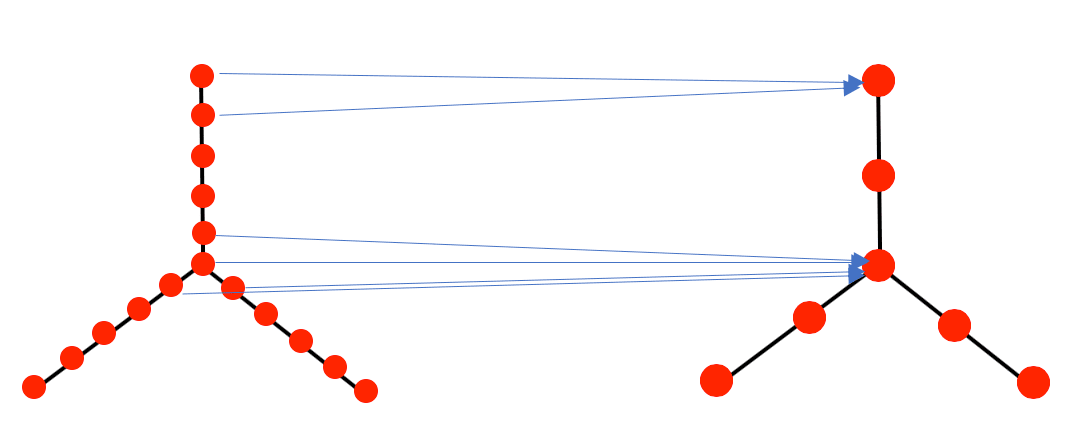
The construction of neural networks from the purely data driven constructions above is also quite simple. Since each node of each graph corresponds to a set of features from the data matrix, we can declare that a node ν in ⌈r is connected by a directed edge to a node w in ⌈r+1 if and only if the collection corresponding to ν and the collection corresponding to w contain at least one feature in common. This will describe a connection pattern for a simple feed-forward network with the nodes of ⌈r as the set of neurons in the r-th layer. A picture of a simple version of this construction is given below.
Summary
We have given an approach to assigning graph theoretic information to sensory or continuous data. It depends on the assignment of geometric information in the form of a distance function on the set of features of a data set. There are many constructions based on the mathematical discipline of topology (the study of shape) that should be useful for this task. The methodology should yield the following:
- Improvement of the transparency of the algorithms, since the sets of neurons are now organized in understandable geometric patterns. In particular, coloring the geometric structures by activation values of neurons will make clearer the functioning of the network.
- Improvement in the explainability of the outputs, based also on the coloring of the topological models of the feature sets. What such colorings often yield is a simplified understanding of the behavior of data based on groups of features rather than individual features, as is shown in the Ayasdi blog “Machine Intelligence for Statistical Inference and Human Interpreta….”
- Because the topological model constructions have nodes that deal with groups of features, it is to be expected that using such models will help reduce the overfitting often occurring in such models. Preliminary experiments suggest that this does in fact occur.
- Structures that lend themselves to topological data analysis may be classified and their topological properties might have interesting and useful interpretations. For example, it has been shown that the spatial filters of CNN’s arrange themselves in simple circles and that these are indicative of a network’s ability to generalize to unseen data. In addition, the persistent homology of the activation maps of CNN’s can be used to detect adversarial examples.