This article was written by Stuart Reid.
This tutorial covers regression analysis using the Python StatsModels package with Quandl integration. For motivational purposes, here is what we are working towards: a regression analysis program which receives multiple data-set names from Quandl.com, automatically downloads the data, analyses it, and plots the results in a new window.
TYPES OF REGRESSION ANALYSIS
Linear regression analysis fits a straight line to some data in order to capture the linear relationship between that data. The regression line is constructed by optimizing the parameters of the straight line function such that the line best fits a sample of (x, y) observations where y is a variable dependent on the value of x. Regression analysis is used extensively in economics, risk management, and trading. One cool application of regression analysis is in calibrating certain stochastic process models such as the Ornstein Uhlenbeck stochastic process.
Non-linear regression analysis uses a curved function, usually a polynomial, to capture the non-linear relationship between the two variables. The regression is often constructed by optimizing the parameters of a higher-order polynomial such that the line best fits a sample of (x, y) observations. In the article, Ten Misconceptions about Neural Networks in Finance and Trading, it is shown that a neural network is essentially approximating a multiple non-linear regression function between the inputs into the neural network and the outputs.
The case for linear vs. non-linear regression analysis in finance remains open. The issue with linear models is that they often under-fit and may also assert assumptions on the variables and the main issue with non-linear models is that they often over-fit. Training and data-preparation techniques can be used to minimize over-fitting.
A multiple linear regression analysis is a used for predicting the values of a set of dependent variables, Y, using two or more sets of independent variables e.g. X1, X2, …, Xn. E.g. you could try to forecast share prices using one fundamental indicator like the PE ratio, or you could used multiple indicators together like the PE, DY, DE ratios, and the share’s EPS. Interestingly there is almost no difference between a multiple linear regression and a perceptron (also known as an artificial neuron, the building blocks of neural networks). Both are calculated as the weighted sum of the input vector plus some constant or bias which is used to shift the function. The only difference is that the input signal into the perceptron is fed into an activation function which is often non-linear.
If the objective of the multiple linear regression is to classify patterns between different classes and not regress a quantity then another approach is to make use of clustering algorithms. Clustering is particularly useful when the data contains multiple classes and more than one linear relationship. Once the data set has been partitioned further regression analysis can be performed on each class. Some useful clustering algorithms are the K-Means Clustering Algorithm and one of my favourite computational intelligence algorithms, Ant Colony Optimization.
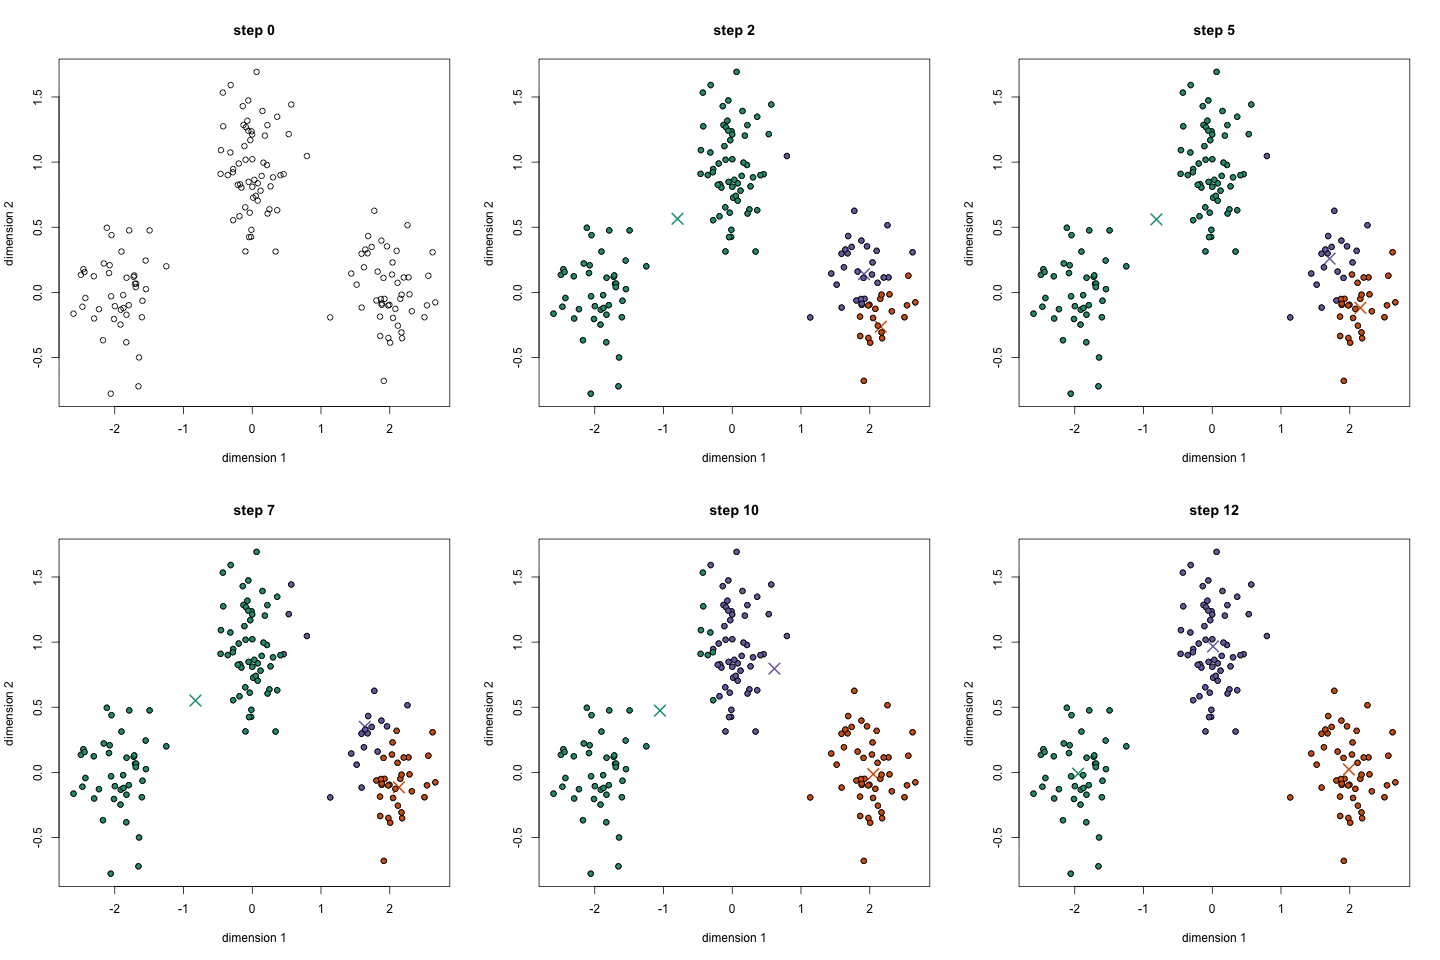
The image below shows how the K-Means clustering algorithm can be used to partition data into clusters (classes). Regression can then be performed on each class individually.

Logistic Regression Analysis – linear regressions deal with continuous valued series whereas a logistic regression deals with categorical (discrete) values. Discrete values are difficult to work with because they are non differentiable so gradient-based optimization techniques don’t apply.
Stepwise Regression Analysis – this is the name given to the iterative construction of a multiple regression model. It works by automatic selecting statistically significant independent variables to include in the regression analysis. This is achieved either by either growing or pruning the variables included in the regression analysis.
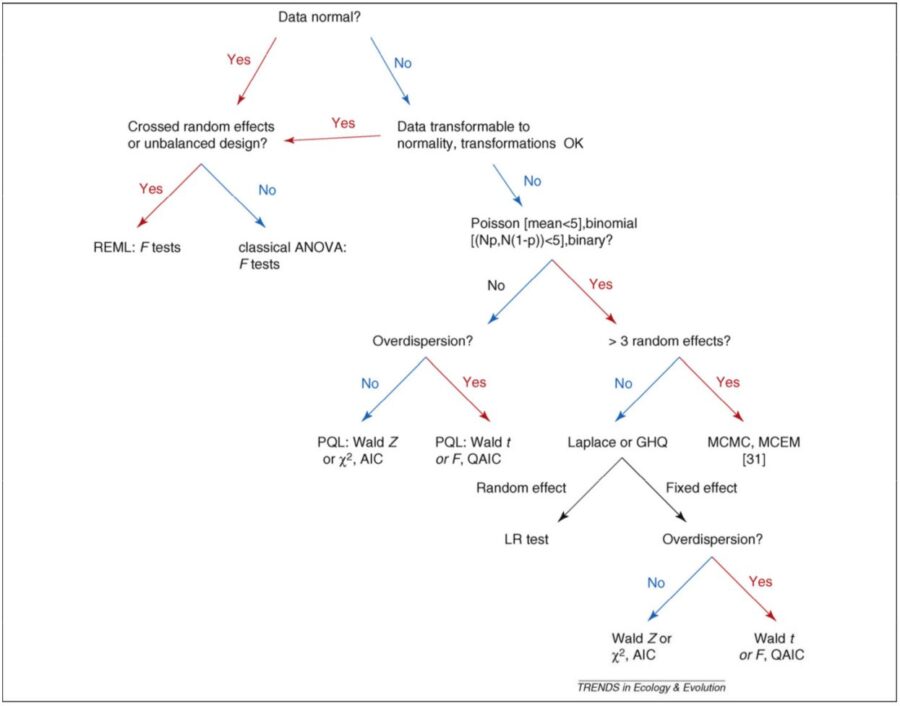
Many other regression analyses exist, and in particular, mixed models are worth mentioning here. Mixed models is is an extension to the generalized linear model in which the linear predictor contains random effects in addition to the usual fixed effects. This decision tree can be used to help determine the right components for a model.
To read the whole article, with illustrations, click here.

