
Making money is very easy from Restaurant but consistency on success run is the difficult part due to various factors like competitors, customer needs in terms of variety , holiday specials and luxury expectations in dining. These could be maintained easily if we look at our past business & predict the future by injecting various parameters in it.
Here, I have taken data from online to prepare a prediction plan for group restaurants , those are using the site for service.
Customer Visit ratio between Holiday & Week days:
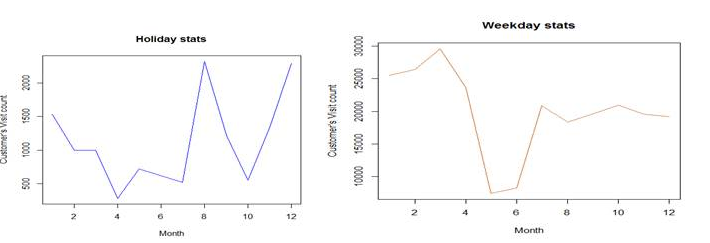
On compare customer visit between holiday and weekdays, number of customer count is higher in weekdays. Population density , daily commuting might be the reason for people to visit the restaurant at weekdays. this will be confirmed from below illustration.
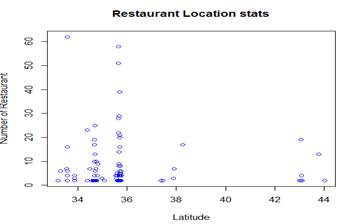
From Restaurant location stats, we concluded that range of latitude 32 to 38 is having more restaurants. we will include ‘genre name’ as parameter to identify which category of food like most by people.
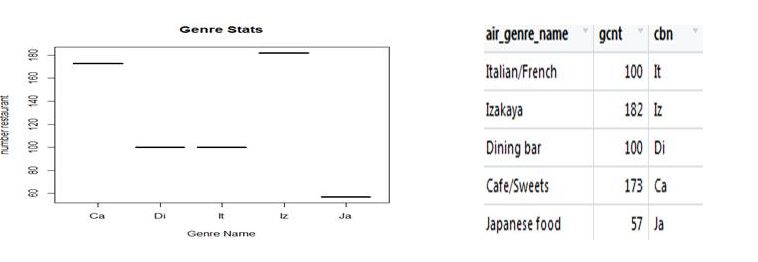
Top most genre name has been identified to narrate people’s taste in the restaurant which we identified in above analysis.
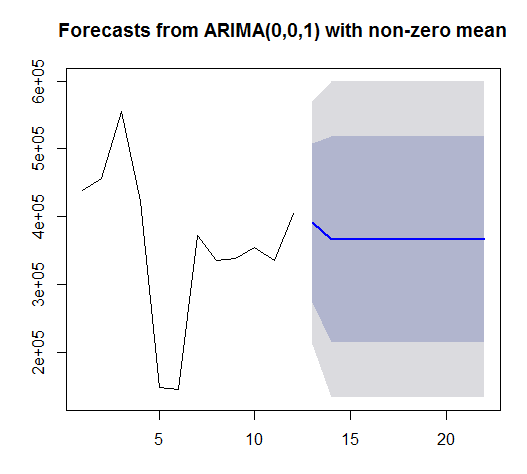
Prediction:
Based on genre and people visit in the particular latitude of restaurant. We would predict the customer’s visit on upcoming months. as you seen in the below prediction, customer used to visit the restaurant at first half of year is more than rest of the year. Hence, we would increase the staff member & other crucial item to be available at first quarter to manage business and gaining customer’s confidence.
Graphical Representation :
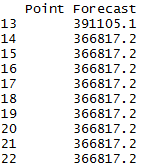
The result is in number below,
As we have taken first 12 months data for analysis & predict the customer visit on upcoming months. It is like sample for the scenario that we choose it. If we want to create a exact model, then we will inject more parameters to steady the model for getting the results.
Keep Looking this space more updates related to Data!. Happy Learning. Thanks to all who spend time to read this article.