
I was given 3 GB of Machine Generated data being fed by 120 sensors (5 records every second) in an excel format. The task in hand was to mine out interesting patterns, if any, from the data.
I fed the data in R in my local machine and performed various descriptive and exploratory analysis to have some insights. Customer was also looking for some low cost maintenance mechanisms for their machines. So I thought if I could study the outliers and provide some information about system health. This could also be monitored real time using dashboards and if possible could forecast at a near future time point for early alarm and predictive maintenance.
So this became a case of outlier detection in 120 dimensional space. Now, as I studied, values in around 90 columns were found to be constant over the entire time period and were contributing nothing towards system noise. So I dropped them.
Mahalanobis Distance is an age old time tested distance function in a multivariate setup. It weighs the individual euclidean distances with the inverse of the sample variance matrix.
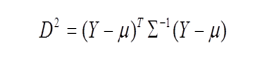
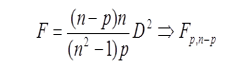
Mahalanobis Distance follows F-Distribution when properly scaled. It requires Normality assumption too.
 My first attempt to calculate the Mahalanobis Distances from the central value failed due to singular variance matrix. I found 6 pairs of highly correlated columns that I then dropped, one from each pair, from analysis to reduce multicollinearity. The piece of code ran successfully.
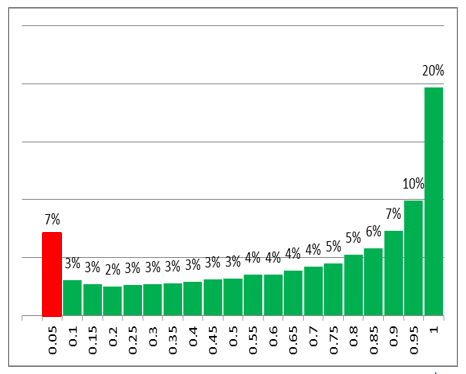
The above empirical distribution of p-values shows in around 7% of entire time points the machine / system is in extreme state producing outliers.
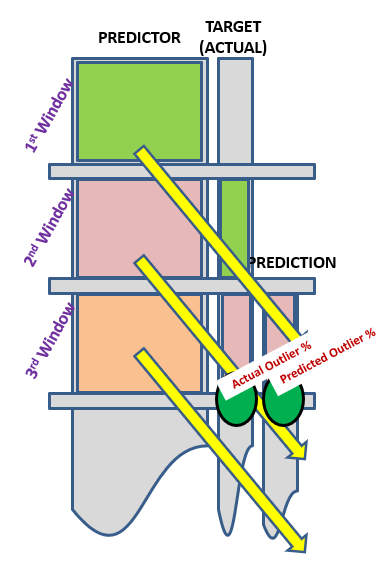
A two hour window is deployed to calculate the Outlier Percentages and Lead Regression is used for forecasting.
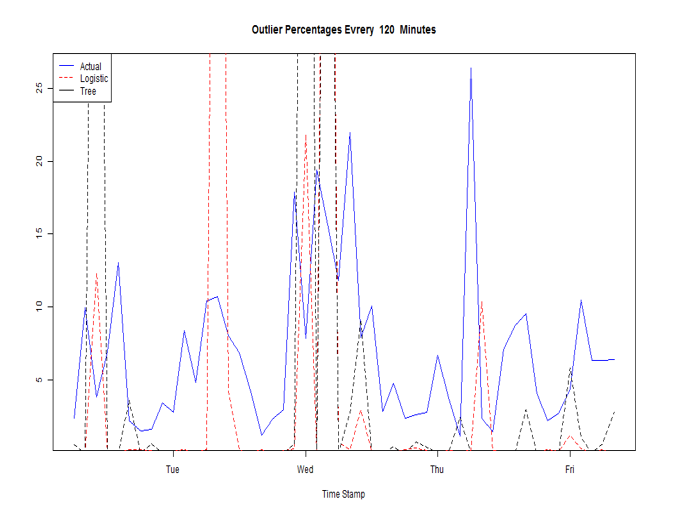
Performance of Logistic Regression and Decision Tree as the classifiers of the outliers in forecasting outlier percentages could be visualized above.
The entire game was pretty satisfying.